Introduction
As an investor aiming to manage your portfolio effectively, one of the most important tasks is tracking and calculating your investment returns. Understanding your returns allows you to evaluate how your investments are performing over time and whether your strategy is on the right track.
However, not all return calculation methods are created equal, and using the wrong approach can lead to misleading outcomes. In this blog post, we’ll explore different methods for calculating returns, highlight their advantages and disadvantages, and explain the methods used by Portfellow.
Why is it important to calculate returns?
Calculating returns is crucial because it gives you a clear picture of your investment performance. Without this information, you cannot objectively assess whether you are on track to meet your financial goals or accurately compare one investment to another.
Although many banks and investment platforms display returns, the information they provide can often be misleading. They usually consider only open positions, overlooking sales, transaction fees, interest, and dividends. Additionally, the returns shown are often not annualized, which means they don’t accurately reflect your investments’ yearly performance.
This approach can create a false impression that an investment is performing better than it actually is. For instance, an investment might seem profitable, even though significant losses from sales or fees have been ignored. Therefore, it is essential to use precise and reliable methods for calculating returns that account for all your investments and transactions.
Time-Weighted return vs. Money-Weighted return
Before delving into specific return calculation methods, it’s crucial to understand the difference between Time-Weighted Return (TWR) and Money-Weighted Return (MWR).
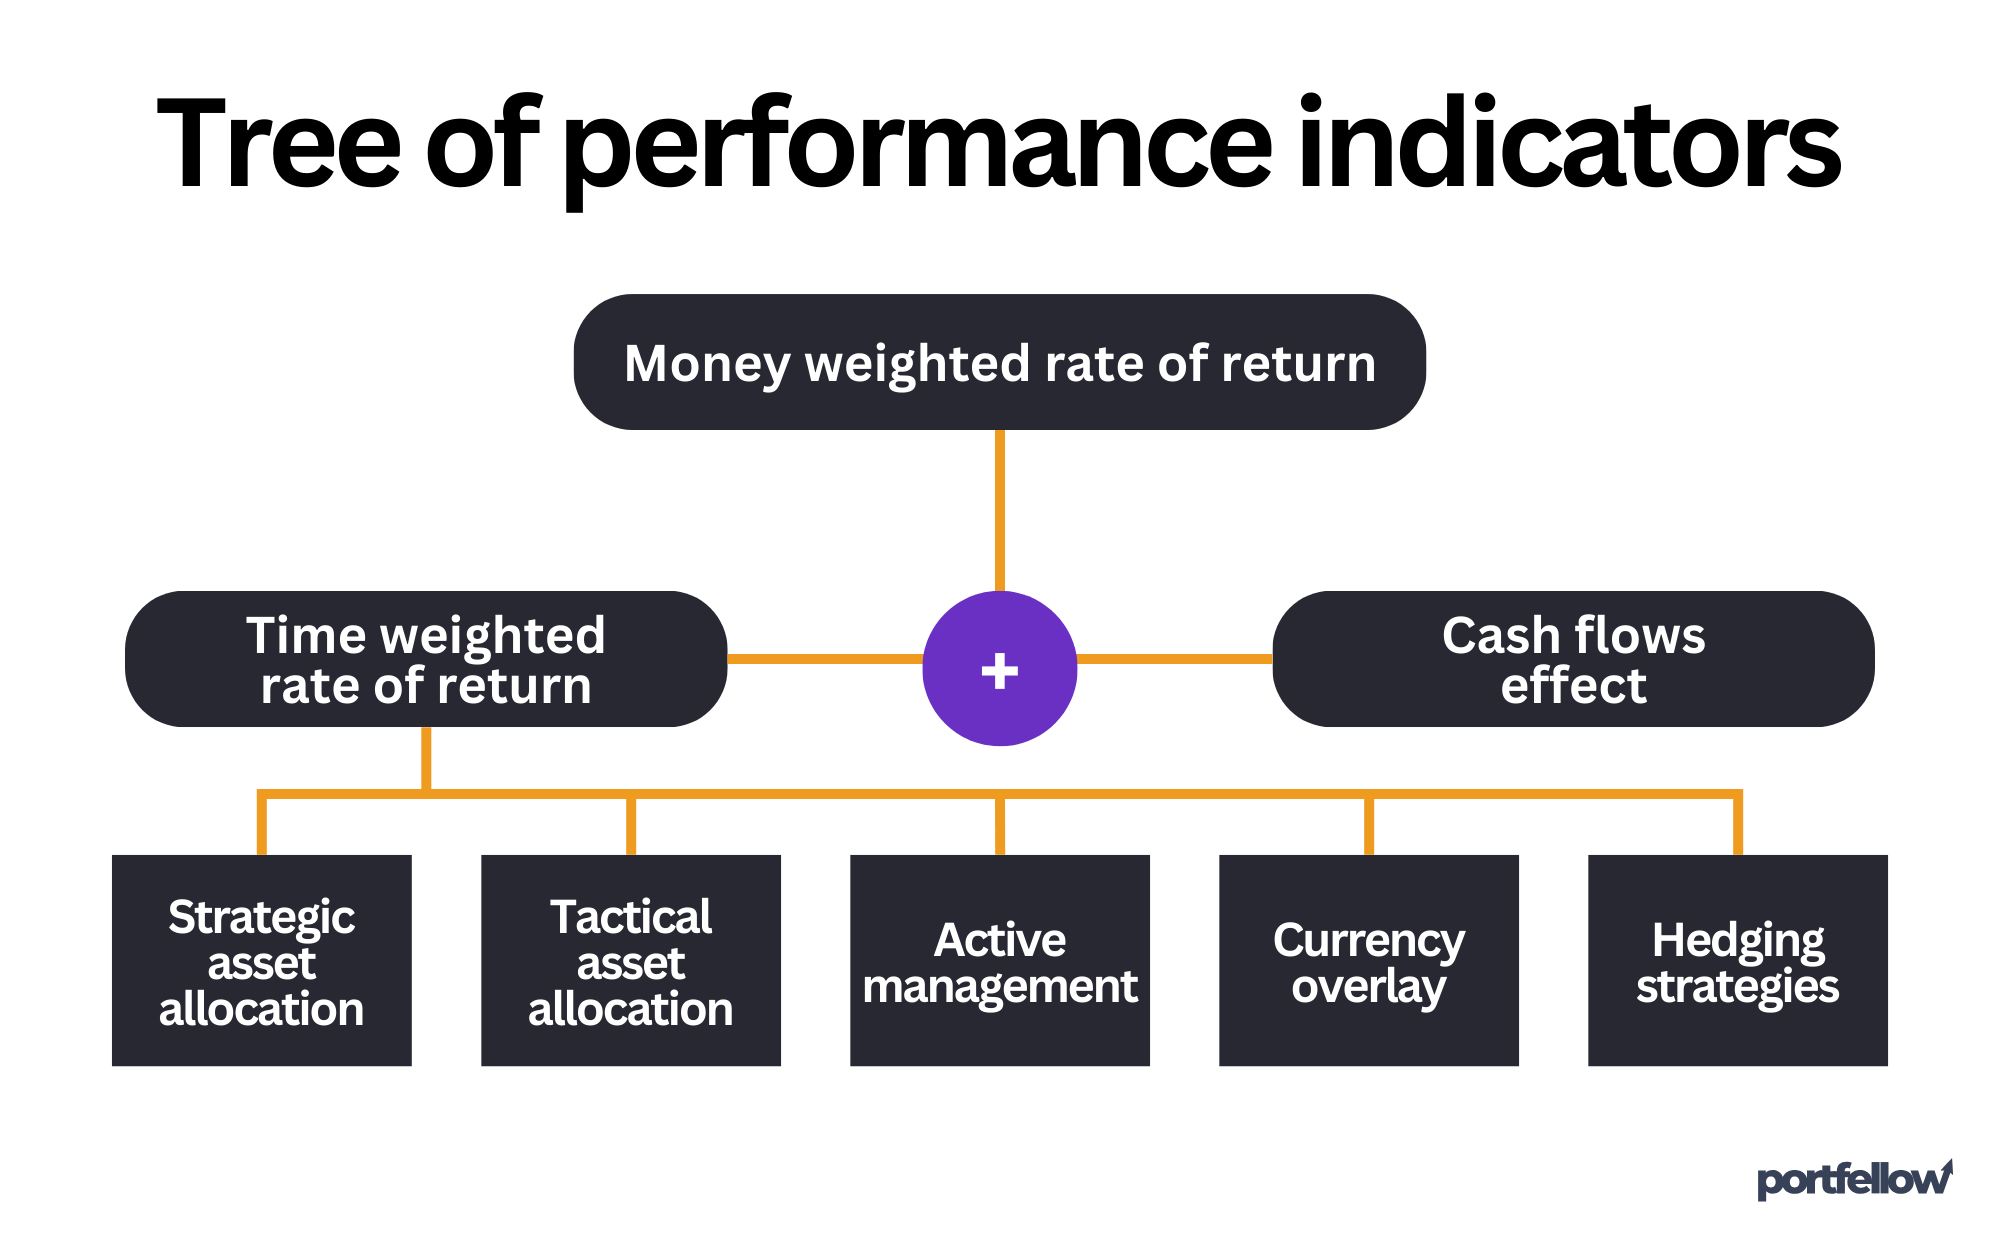
The chart above illustrates how the Money-Weighted Rate of Return (MWR) is calculated by taking various factors into account. MWR is influenced by two main components: the Time-Weighted Rate of Return (TWR) and the impact of cash flows.
The TWRR is further driven by five key factors:
- Strategic asset allocation:
A long-term investment strategy that distributes assets across various categories. - Tactical asset allocation:
Short-term adjustments to the asset mix to take advantage of market opportunities. - Active management:
Decisions made by portfolio managers to outperform the market. - Currency overlay:
Managing currency risk in international investments. - Hedging strategies:
Techniques used to reduce potential losses.
These elements collectively contribute to the overall return on an investment, highlighting how both the timing and allocation of assets, as well as cash flow activities, influence performance.
Time-Weighted Rate of Return
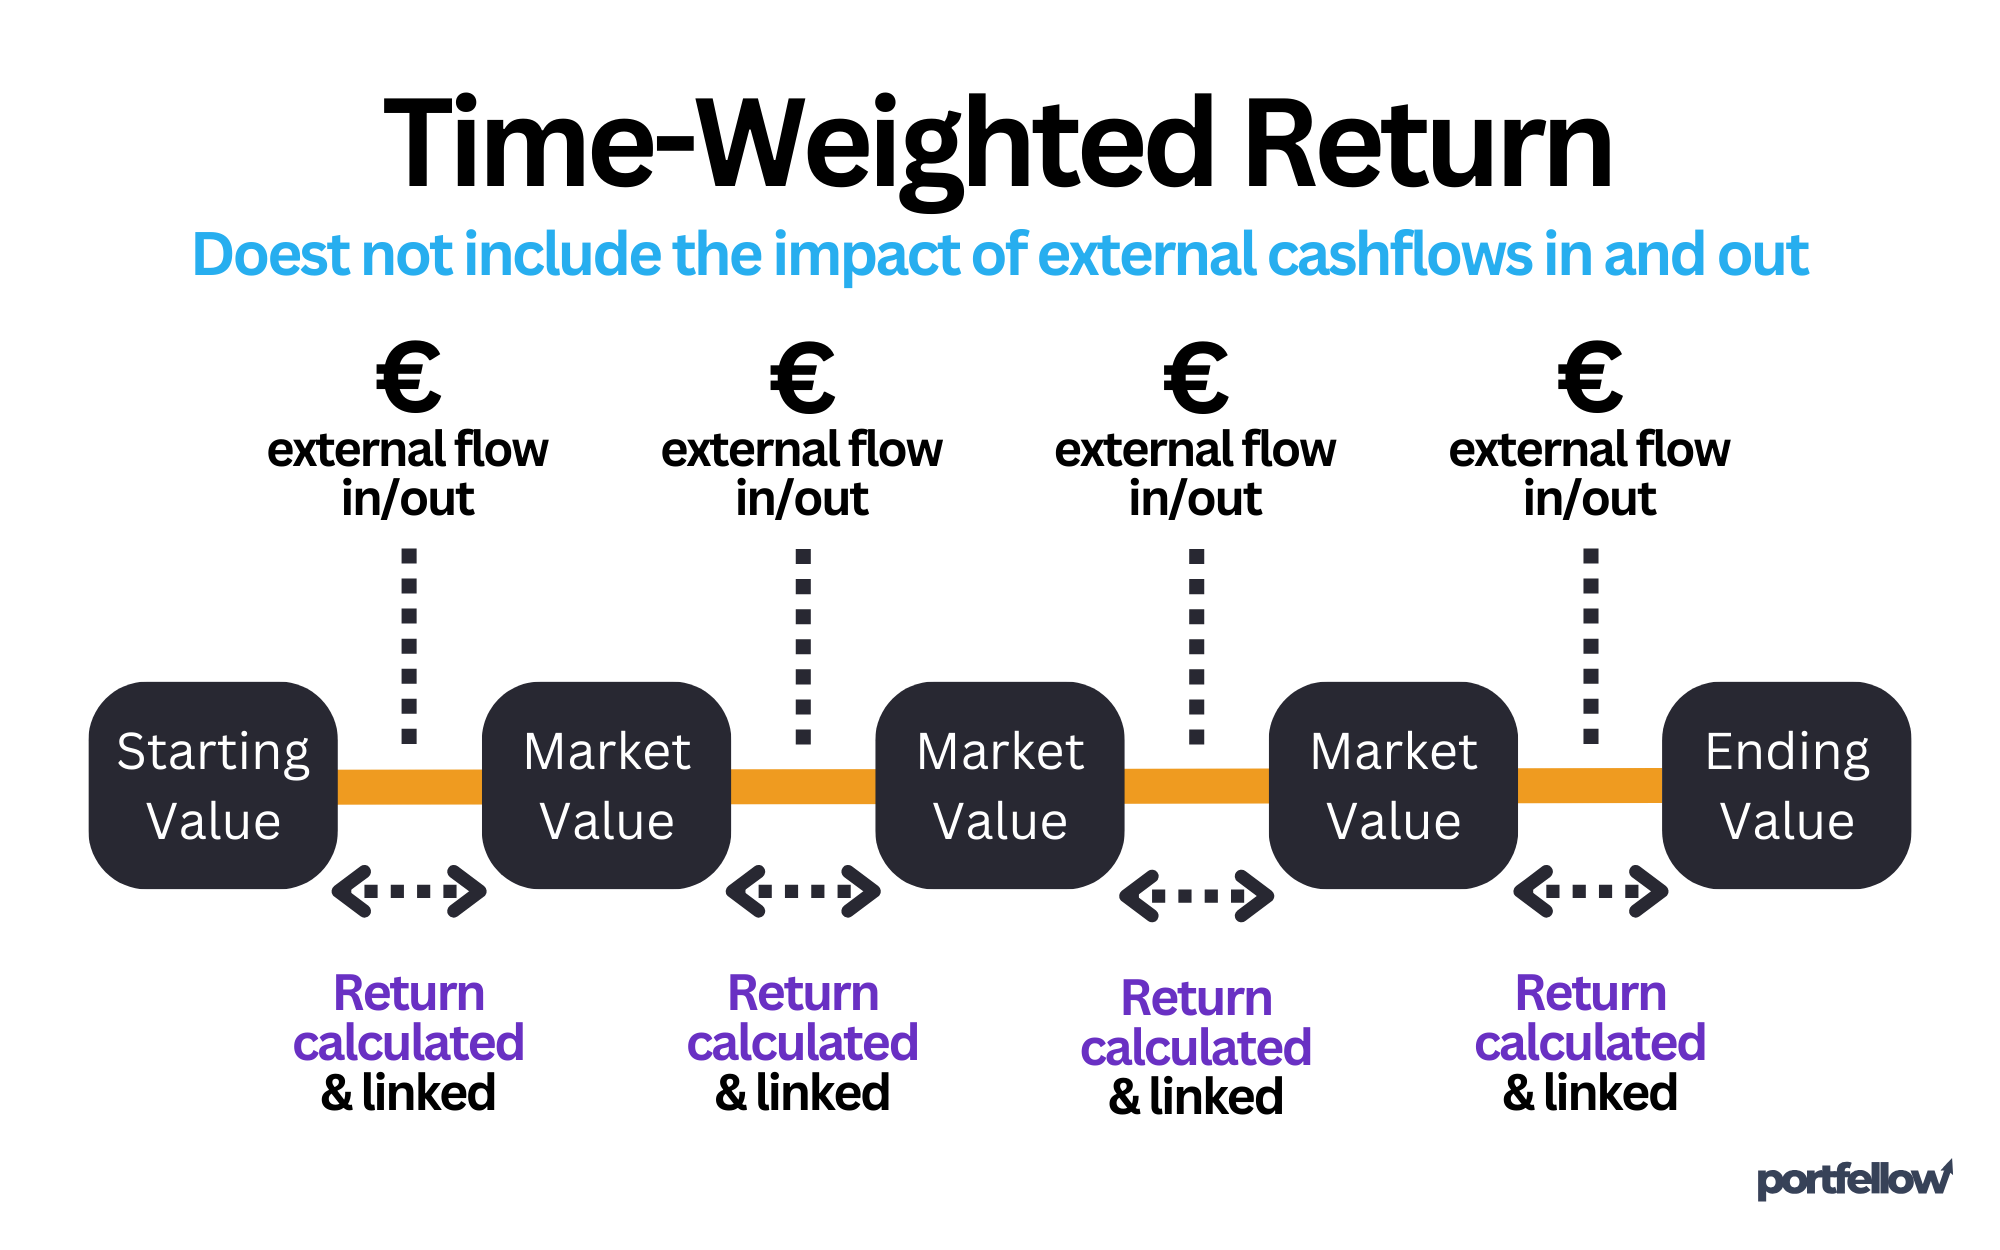
The Time-Weighted Rate of Return (TWR) measures the performance of an investment independently of cash flows, such as contributions or withdrawals. It focuses exclusively on the investment’s performance, making it a valuable tool for evaluating the effectiveness of a portfolio or fund manager, as it removes the influence of cash flows on the portfolio’s return.
Total Time-Weighted return is calculated by fining returns over sub-periods and then compounded together, with each sub-period weighted according to its duration. To calculate Time-Weighted Return (TWR) in Excel, start by gathering the necessary data: the portfolio values before and after any cash flows, as well as the dates these flows occurred. Then, calculate the periodic return for each interval and then link them together. You can read more from Wikipedia.
Money-Weighted Rate of Return
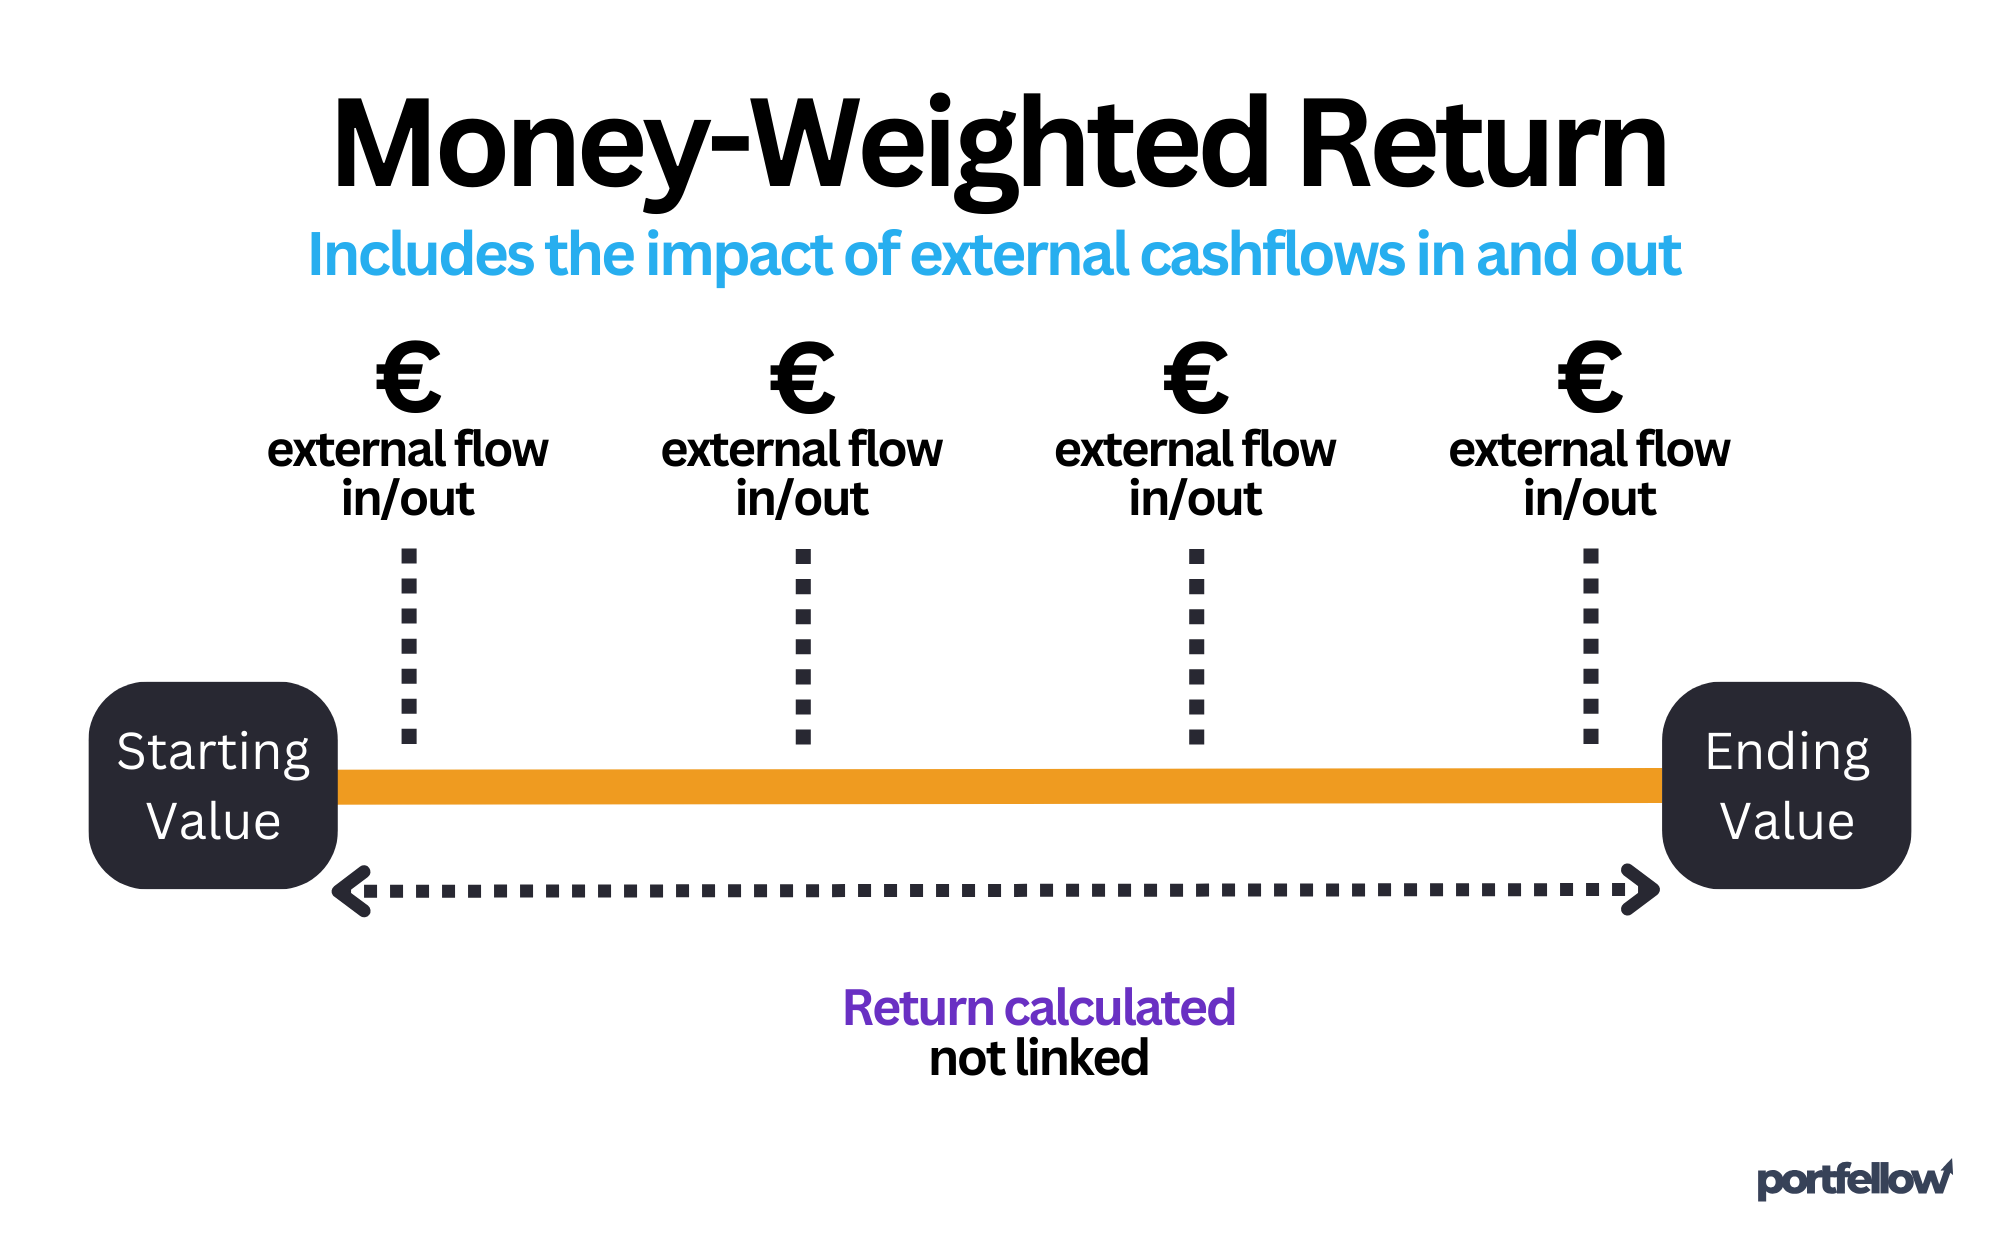
The Money-Weighted Rate of Return (MWR), also known as the Internal Rate of Return (IRR), considers cash flows and their timing. It reflects how your decisions to move money in and out of the portfolio have affected the returns. MWR is useful when you want to understand your personal return, taking into account all transactions and their timing.
Which method to choose?
If you want to assess the overall performance of your investments and evaluate your investment decisions or compare it with some other investor, without considering cash flows, choose TWR. However, if you wish to measure how your personal cash flows and timing decisions have impacted returns, or see your full reterun, MWR is the better choice.
Performance calculation methods used by Portfellow
On the Portfellow platform, you can choose from three different methods for calculating returns:
- XIRR (Extended Internal Rate of Return):
XIRR is an extended version of the internal rate of return (IRR), accounting for all cash flows and their timing. Unlike regular IRR, XIRR can handle irregular cash flows. This method is ideal if your portfolio includes contributions and withdrawals at various times. XIRR provides an accurate picture of how your investments have grown over time, considering all inflows and outflows.
- Linear Modified Dietz:
The Linear Modified Dietz method offers a simplified approach that accounts for cash flows but assumes they occur evenly throughout the period. This method is best suited when cash flows are relatively regular, and you need a quick overview of portfolio performance.
- CGAR Modified Dietz:
CGAR (Compounded Growth Annualized Return) Modified Dietz is a more advanced version that calculates returns year-over-year, offering a better assessment of long-term portfolio performance. This method is useful when you want to see how the portfolio has grown over time, taking into account all cash flows throughout the period.
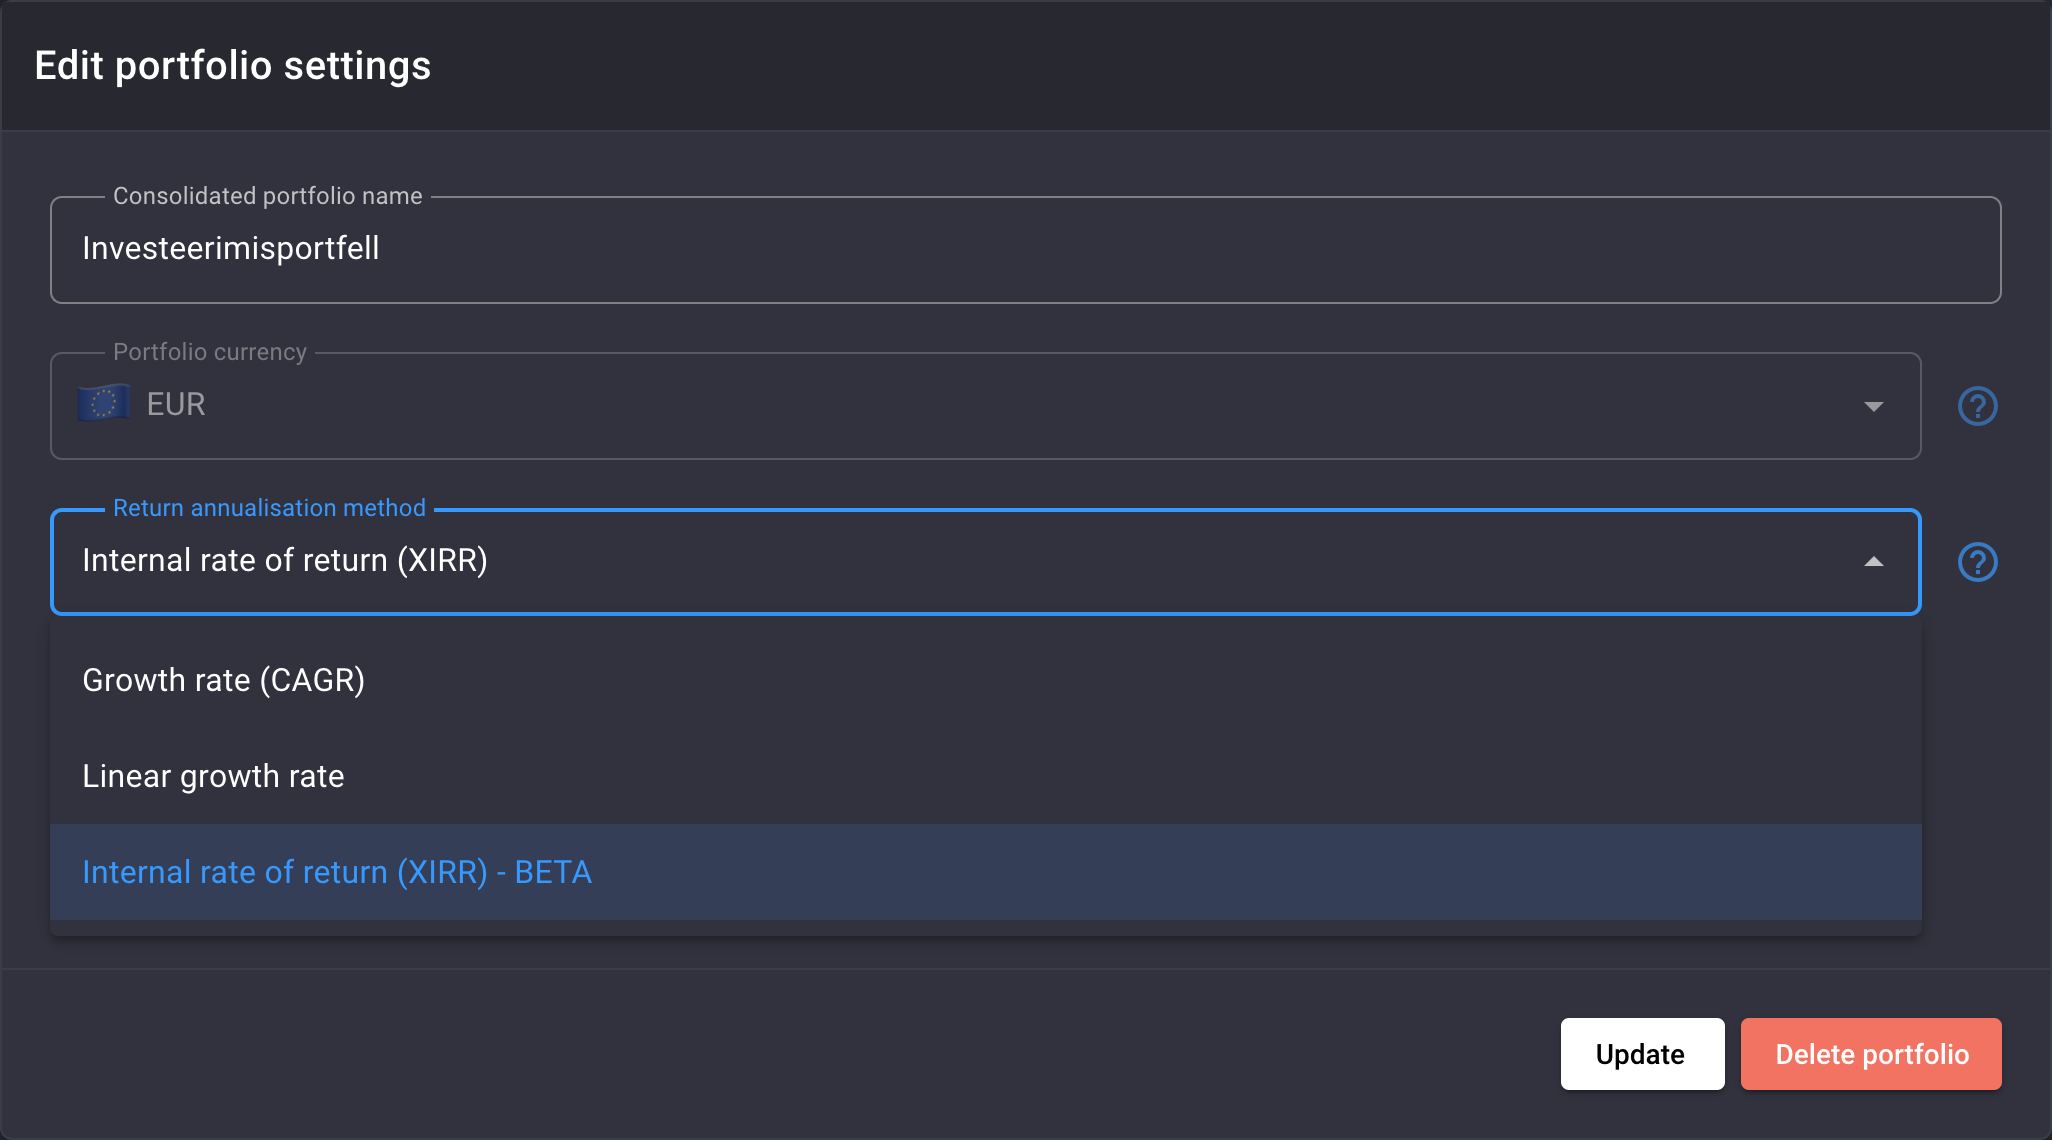
Each of these three methods has its own strengths and weaknesses. While CGAR and XIRR typically produce similar returns, the differences can be more pronounced in certain extreme cases. For instance, significant cash movements during the period, relative to the average investment size, can cause noticeable discrepancies. Therefore, it’s beneficial to experiment with different performance calculation methods. However, in general, XIRR is considered the most accurate.
Factors Portfellow takes into account to calculate performance
Portfellow offers a detailed and nuanced analysis of your investment performance by considering various factors. Each of these factors plays a crucial role in shaping the overall return on your investments, ensuring that you gain a comprehensive understanding of how your portfolio is truly performing.
Capital gains are just one aspect of your investment performance. Portfellow takes the following factors into account when calculating your total return:
- Capital gains;
- Dividends, interests and other distributions;
- Currency fluctuations;
- Brokerage costs;
- Time and timing of cash out- and inflow.
Let’s explore why each of these factors is essential in providing the most accurate picture of your investment performance.

Component returns
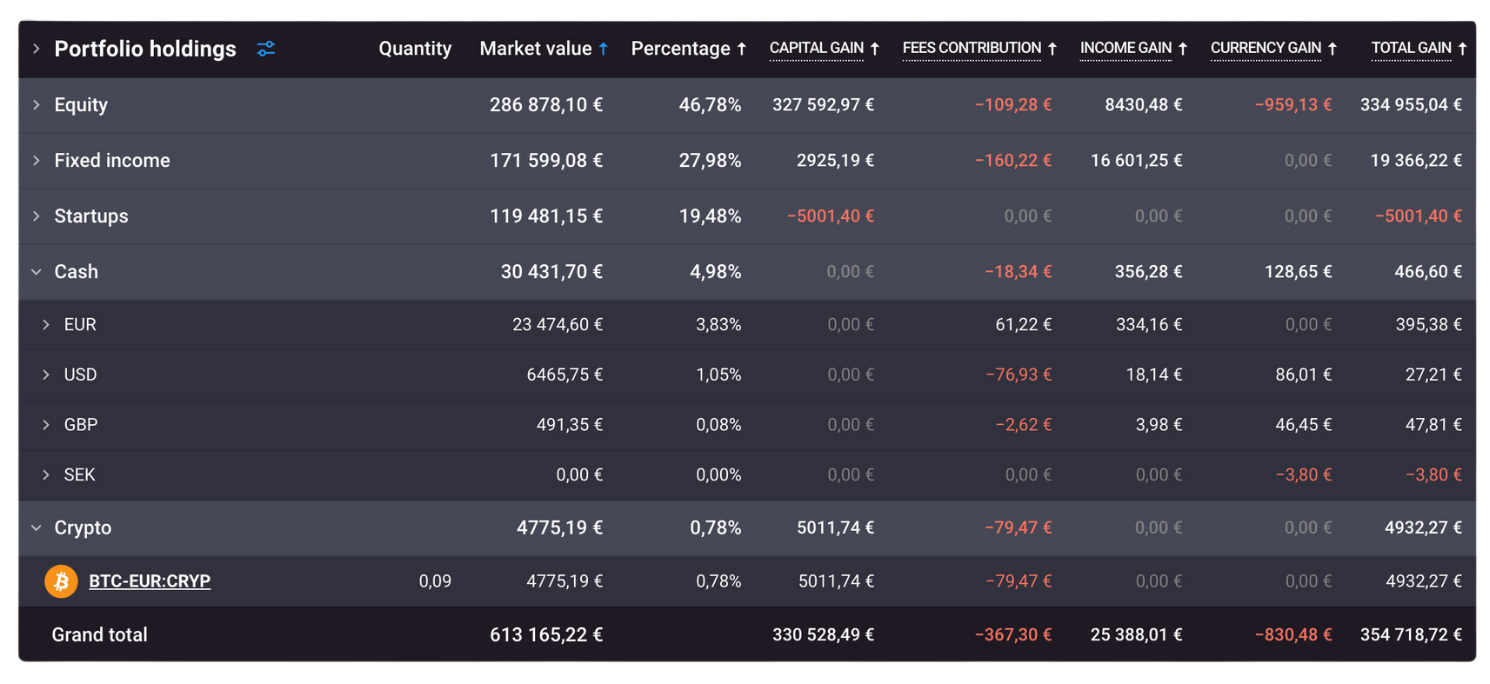
Your total return is composed of four key components: capital gains, dividends, expenses, and currency gains.
Capital gain
This metric reflects the appreciation or depreciation in the value of your assets over time. It is calculated by comparing the purchase price with the current market value of each holding.
Capital gains occur when the market value of an asset increases, while capital losses happen when the value decreases. This factor is crucial as it directly measures the success of your investment decisions in terms of asset value growth or decline.
Monitoring capital gains and losses helps you understand how well your investments are performing in the market and informs decisions about whether to hold, sell, or rebalance your portfolio.
Dividends & distributions
Income return encompasses the dividends, interest payments, and other income generated by your investments. For income-generating assets like dividend-paying stocks, bonds, or real estate investment trusts (REITs), this metric is particularly important. It reflects the return you receive from the cash flow produced by your holdings, which can be a significant component of your overall return, especially in low-growth environments.
By tracking income returns, you can assess how well your portfolio is generating consistent revenue, which is crucial for income-focused investors seeking regular payouts.
Brokerage costs
The expenses return considers all costs associated with managing your portfolio, including management fees, transaction costs, commissions, and other related expenses. These costs can erode your overall returns, making it essential to track them carefully. Understanding your expenses allows you to evaluate the net performance of your investments after accounting for fees. This metric helps you identify areas where you might reduce costs, thereby improving your net returns and ensuring your portfolio operates efficiently.
Currency gain
For investors with assets in multiple currencies, currency return is a vital metric. It measures the impact of foreign exchange fluctuations on your investments. When you hold assets denominated in a foreign currency, changes in exchange rates can significantly affect the value of those assets when converted back to your base currency.
For example, even if an asset’s value increases in its local currency, a stronger home currency could reduce or even negate the gain when converted. By tracking currency gains and losses, you can better understand the risks associated with currency exposure and make more informed decisions about currency hedging or diversification.
Total return
Total return is the most comprehensive metric, combining all the factors mentioned above—capital gains, income gains, expenses, and currency gains—into a single, all-encompassing measure of performance.
This metric provides a holistic view of your portfolio’s success by aggregating the effects of market movements, income generation, costs, and currency fluctuations. It is the bottom line of your investment performance, showing you the net result of all factors influencing your portfolio.
Understanding your total return is essential for evaluating the overall effectiveness of your investment strategy and making decisions about future adjustments to meet your financial goals.
Conclusion
Calculating individual investment and portfolio returns is one of the most critical activities in managing an investment portfolio. It’s important to choose the right method that suits your portfolio structure and goals.
Portfellow offers several return calculation methods that help you obtain a precise and comprehensive view of your investment performance. By using the right tools and methods, you can make better and more informed investment decisions.


