For investors who want the honest answer
If you've ever looked at a growing balance and quietly wondered how much of it was actually you, this report is for you.
Regular contributors
Monthly transfers, the occasional bonus, automatic deposits — the discipline is there. The accounting of what it built isn\'t.
Lump-sum and irregular investors
A large deposit lands and the next quarter looks brilliant. You want to know how much of that was the deposit, not the market.
Investors entering the withdrawal phase
Cash flow direction is reversing. Knowing whether the portfolio is being drawn down or simply running on returns matters more than ever.
Anyone preparing an honest self-assessment
Before crediting yourself or the market for a strong year, you want the numbers separated cleanly — not interpreted, not estimated.
A balance history isn't a growth attribution
Most apps show a number going up. None of them tell you which part you earned and which part you simply transferred in.
Brokerage apps stop at the balance
A line going up over twelve months is the headline. The split between capital deployed and returns earned is never on the page.
Total return is contaminated by cash-flow timing
A large deposit in January followed by an ordinary year produces a flattering chart. Without separating flows from returns, the read is always slightly off.
Strong saving years masquerade as strong investing years
A €30,000 increase looks the same whether it came from the market or from your bank account. The two stories are completely different — and they should be.
Withdrawals make good performance look flat
A portfolio that returned 9% but funded a €20,000 expense barely moves on the chart. The performance is real. The chart is misleading.
How the Contributions & Withdrawals Report solves this
A net-deposits chart. Five clean stats. A streak banner. And a long-run stacked view of where your net worth actually came from.
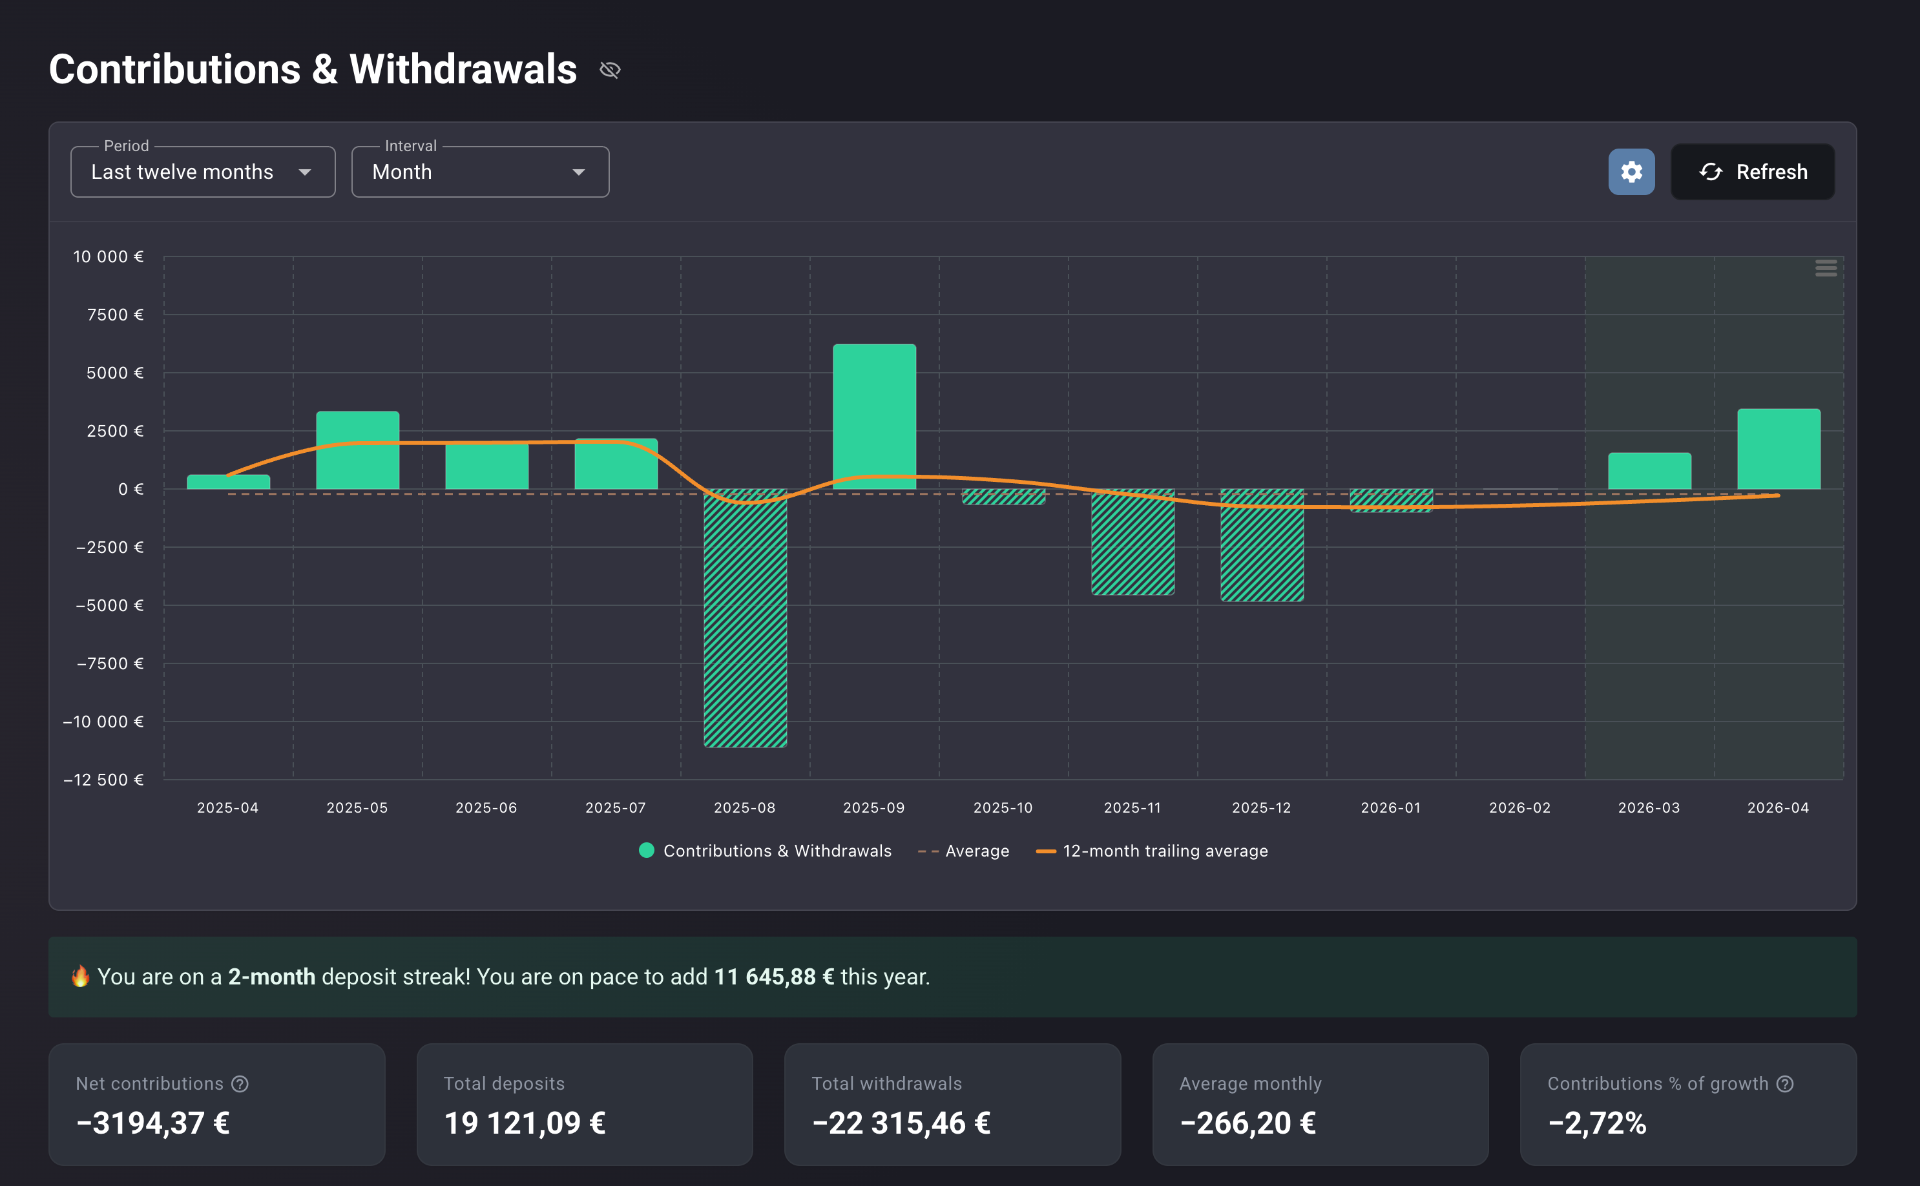
Every deposit and withdrawal, in one read
Each bar is one period's net cash in or out. Solid green for deposit months, hatched green for withdrawal months — the direction of your saving behaviour is visible at a glance.
A 12-month trailing average runs across the chart so you can see the underlying trend in your contribution rate, separated from any single noisy month. Switch the interval between Month and Year to move from granular detail to the long-run pattern.
The arithmetic, separated
Below the chart, five cards distil the period to its essentials: total in, total out, the net, your average monthly pace — and the metric that matters most.
Contributions % of Growth is the honest answer. A small or negative number means the market did the heavy lifting. A large positive number means the portfolio grew because you saved hard. Either is useful information. Neither was previously visible in any standard tracker.
Recognises the discipline. Projects the year.
A persistent banner tracks consecutive months of net deposits — quiet recognition for the saving habit you've built.
Alongside it, a full-year projection extrapolates your current pace into an annual number. A figure you can plug straight into a long-horizon plan, or test against a goal.
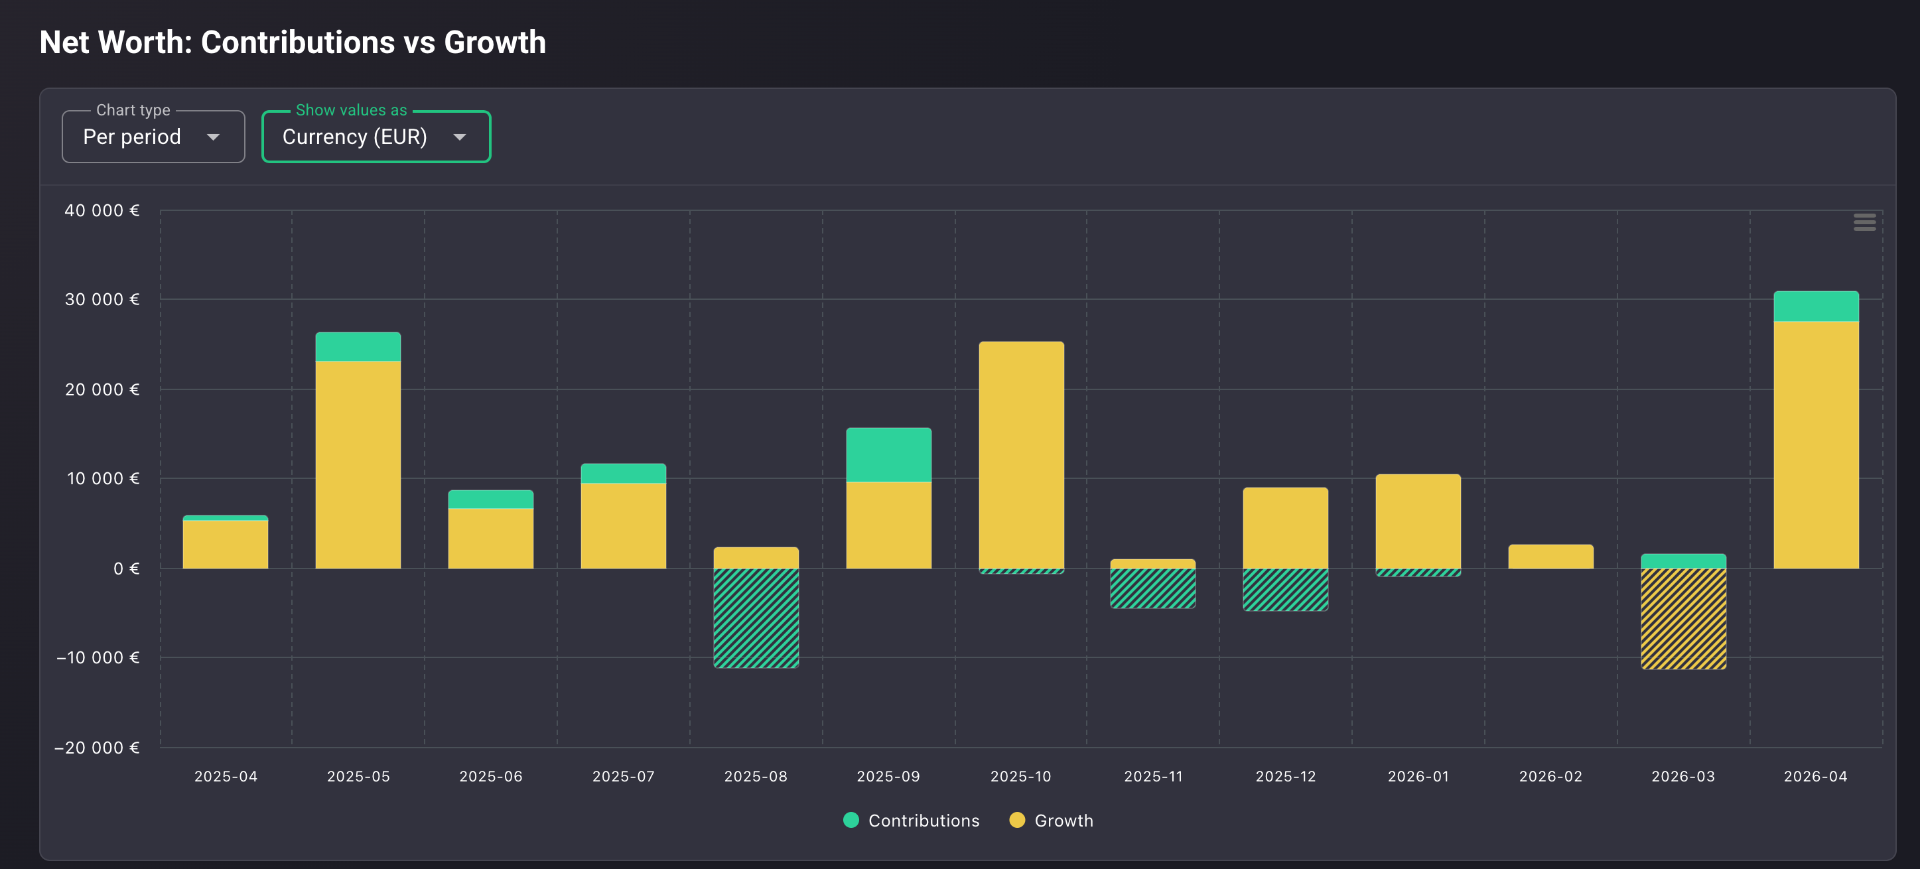
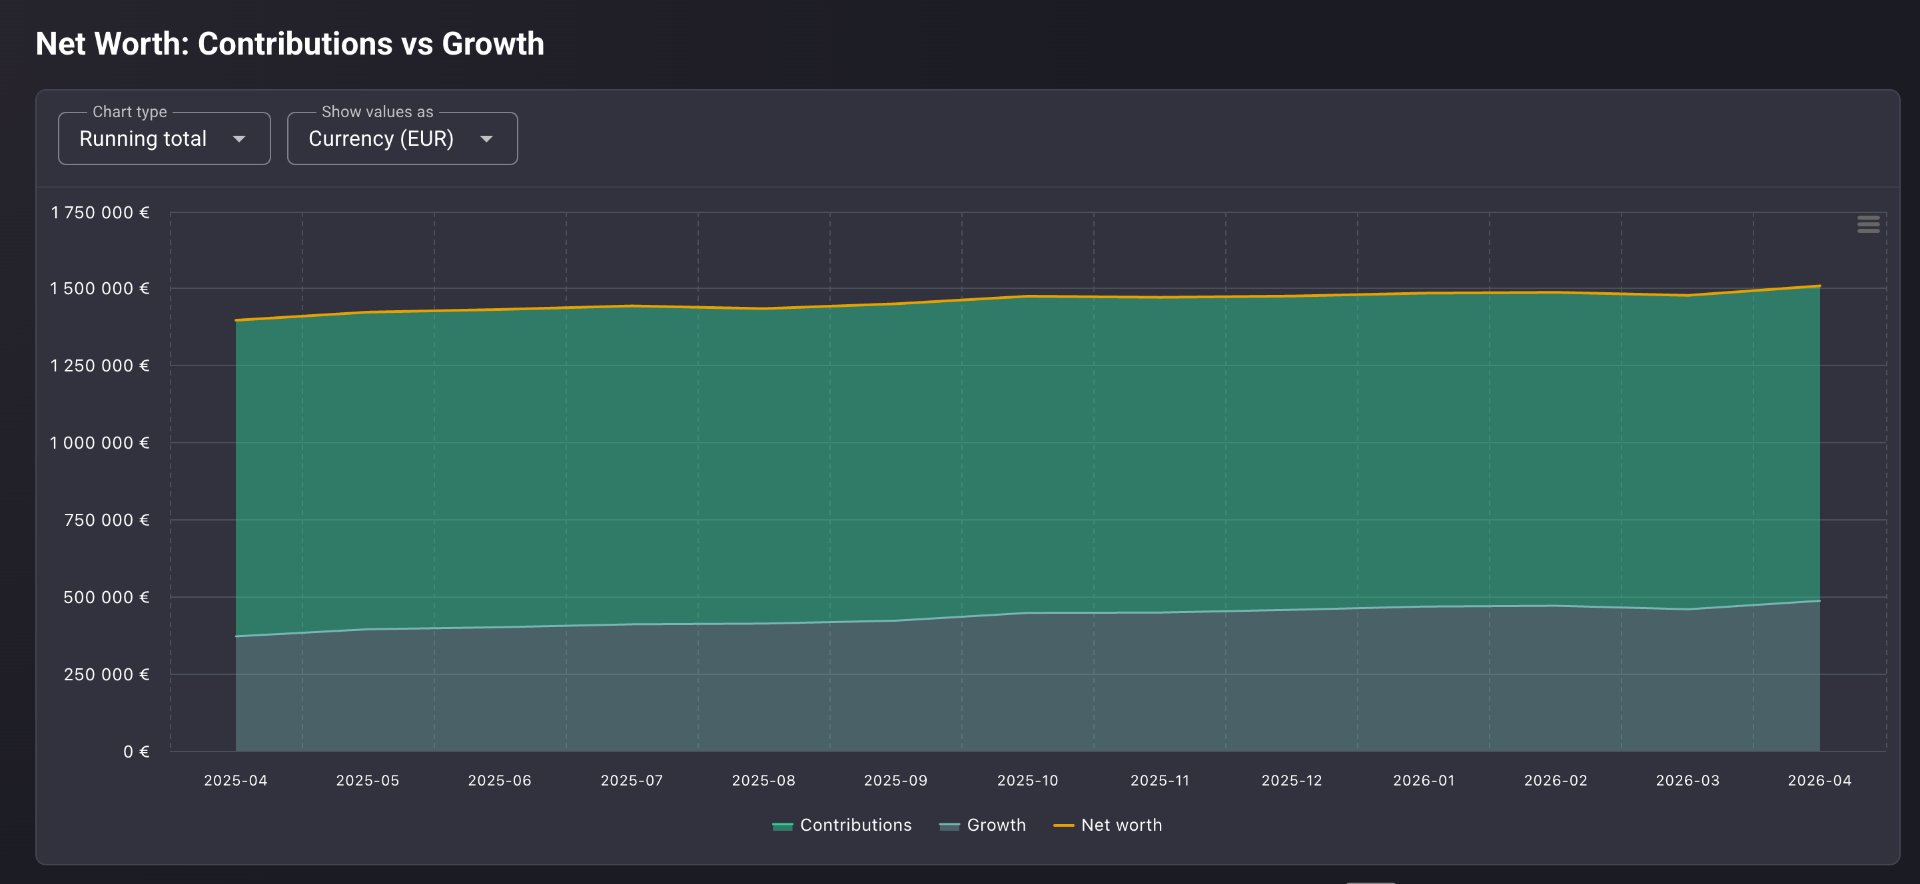
The long-run picture, split honestly
A separate chart breaks every period's net worth movement into two stacked components: the part that came from contributions, and the part that came from investment returns.
In Per period mode, the split is shown month by month. In Running total mode, both are accumulated over time — so the area below the net worth line is divided cleanly between the wealth you saved and the wealth your investments generated. Switch between Currency and Percentage to read either the absolute numbers or the proportions.
Built to answer one specific question
Monthly and annual intervals
Switch between month-by-month detail and the long-run yearly view from the same control. Both reads, no extra clicks.
12-month trailing average overlay
Smooths out single-period noise and surfaces the underlying trend in your saving rate.
Five summary stat cards
Net Contributions, Total Deposits, Total Withdrawals, Average Monthly, and Contributions % of Growth — the metric you couldn't calculate before.
Deposit streak & annual projection
Recognises consecutive contribution months and extrapolates your current pace into a full-year forecast.
Per period & Running total modes
See either each period's split or the cumulative long-run view. Same data, two read-points.
Currency & Percentage toggle
Read absolute euros when the magnitude matters, percentages when the proportion does.
Reflects every instrument that contributes to net worth — cash accounts, equities, ETFs, real estate, bonds, loans — in a single unified view.
Every angle on contributions vs returns
The same underlying data, four different reads. Rotate between them without leaving the page.
Per period in currency. Each month's split between contributions (teal) and investment returns (yellow) — in absolute euros.
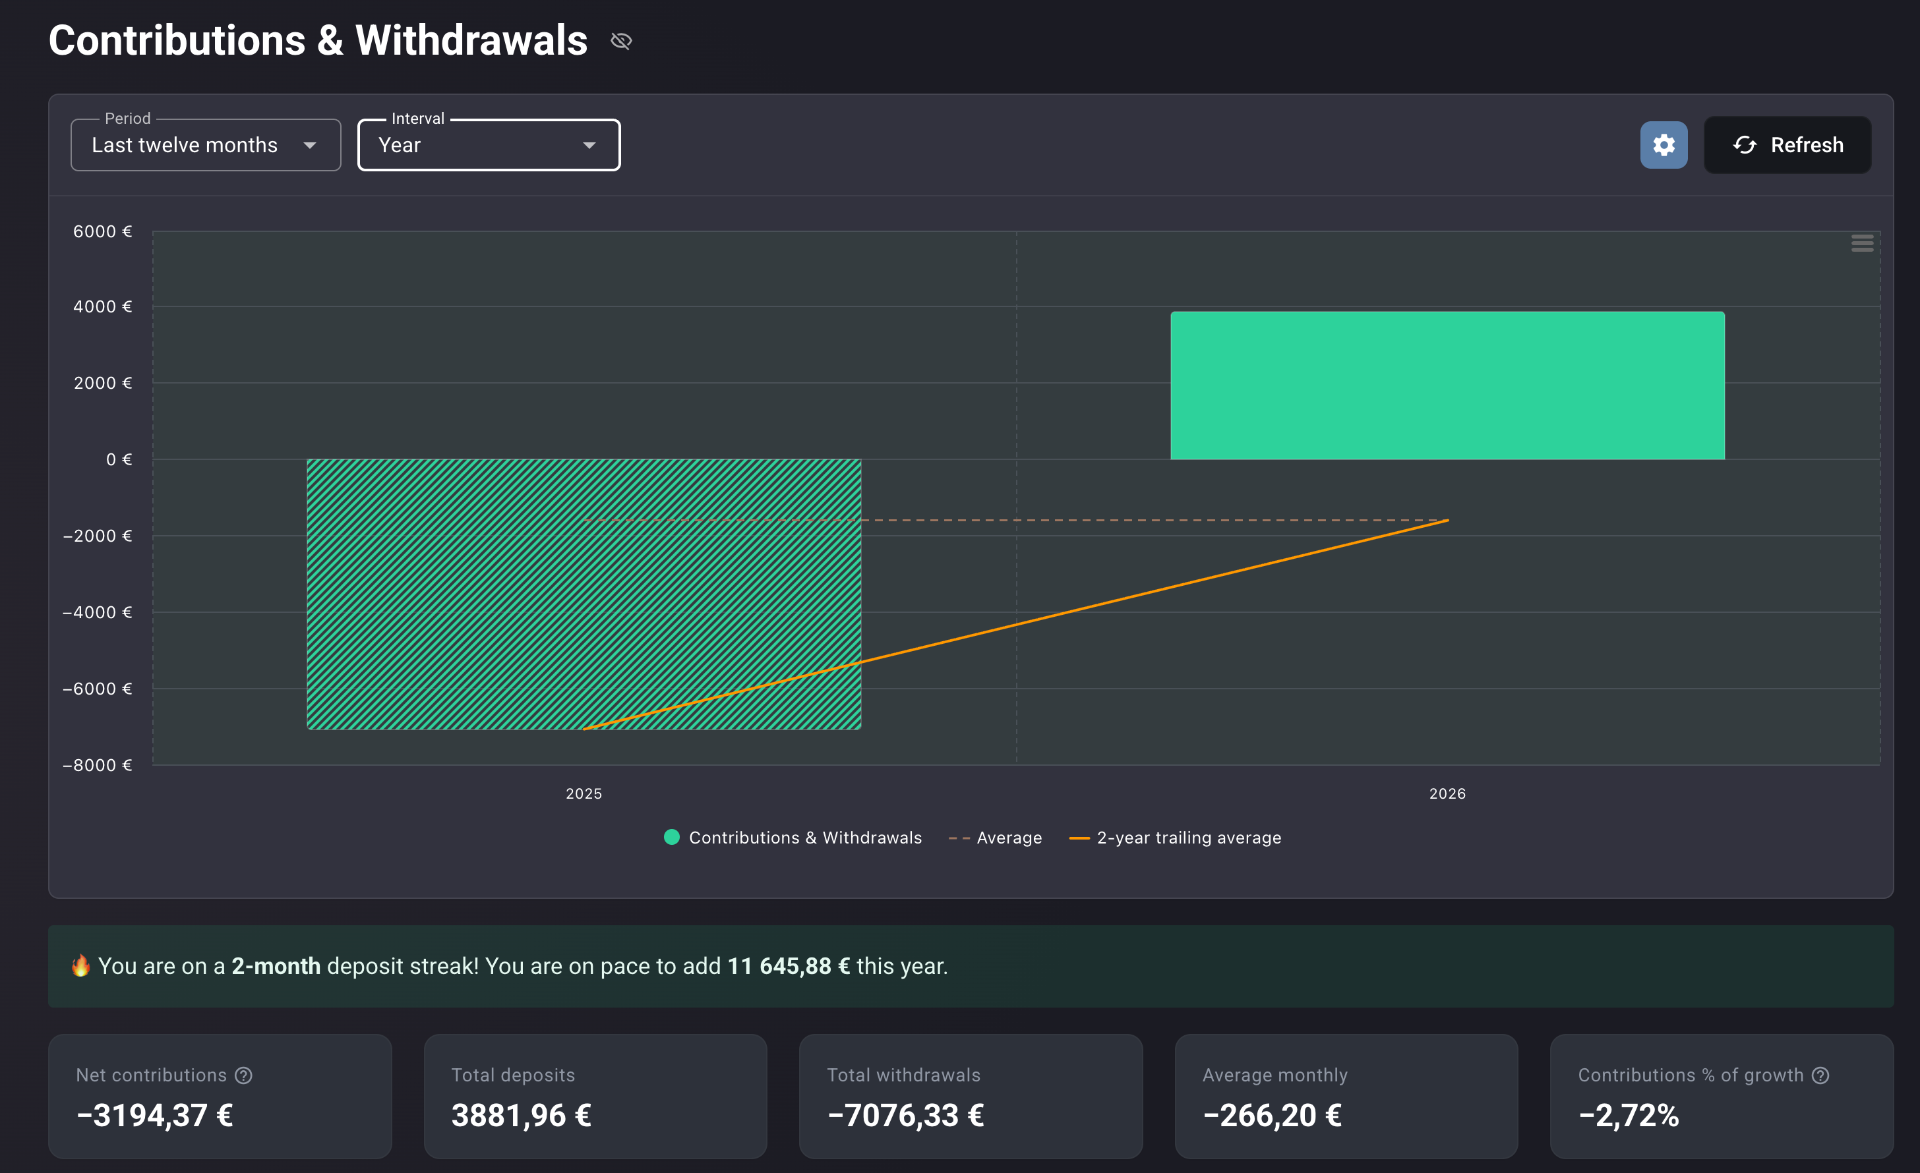
Annual interval. The same bar chart at year granularity — useful for the multi-year pattern.
Real-life use cases
A "good" year that was mostly you
Portfolio grew by €30,000 last year. Contributions % of Growth: 94%. Almost all of that growth was deposits, not investment returns. The number quietly suggests a harder look at asset allocation and risk level.
A realistic baseline for the next decade
Running total view across three years: contributions account for 70% of current net worth, investment returns 30%. A useful baseline for setting honest long-term performance expectations — and for sizing the contributions you'll need going forward.
A pace number that plugs into the plan
A 5-month deposit streak and a projected annual pace of €14,400. Cross-referenced against the Retirement Planning report to test whether the current savings rate is on track for the target.
Fits any contribution pattern
Whether your inflows are steady, lumpy, or reversing — the split between capital and returns is the same essential read.
Regular / DCA investors
Where contribution frequency and amount are as important to long-term outcomes as return rates themselves.
Lump-sum & irregular investors
Where the timing of large deposits can dramatically distort the perception of investment performance.
Pre-retirement & retirees
Where the cash-flow direction is reversing from contributions to withdrawals — and the report stays just as useful.
Financial-independence builders
Where both levers — what you earn and what you add — need to be tracked separately to model the path to a target.
Why Portfellow is different
Brokerage apps show a balance over time. Portfellow shows the two forces that drive that balance — and keeps them apart.
Brokerage apps & generic trackers
- ·Account balance history — and that's it
- ·No separation of capital deployed vs returns earned
- ·Manual CSV export and spreadsheet work to attribute growth
- ·Contributions % of Growth doesn't exist as a metric
- ·Streaks and pace projections nowhere to be seen
Portfellow
- Net deposits chart with a 12-month trailing average
- Five summary stats including Contributions % of Growth
- Long-run stacked view — discipline and performance, separated
- Deposit streak detection and full-year contribution pace
- No spreadsheet, no manual export, no guessing
Suggested workflow
Eleven steps, end to end — from the raw accounts to the honest answer.
- 1Add all accounts and instruments to Portfellow.
- 2Open the Contributions & Withdrawals report.
- 3Set the period and interval — monthly for granular detail, annual for the long-run pattern.
- 4Read the bar chart for deposit and withdrawal timing.
- 5Check the trailing average to see whether your saving rate is trending up or down.
- 6Review the five stat cards, paying particular attention to Contributions % of Growth.
- 7Note your deposit streak and projected annual pace.
- 8Scroll to the Contributions vs. Growth chart.
- 9Switch to Running total + Currency to see the long-run accumulated split.
- 10Switch to Percentage to read the proportion at a glance.
- 11Use the insight to decide whether the growth story is driven by discipline, by performance, or — ideally — both.