What do I own?
See allocation, concentration, and the companies hiding inside your funds.
How is it doing?
Measure returns correctly with XIRR, benchmarks, drawdowns, and holding-level rankings.
Where did the money come from?
Separate net contributions from market returns and audit every transaction behind them.
What's next?
Project future cash flow, retirement drawdown, and the annual story your numbers tell.
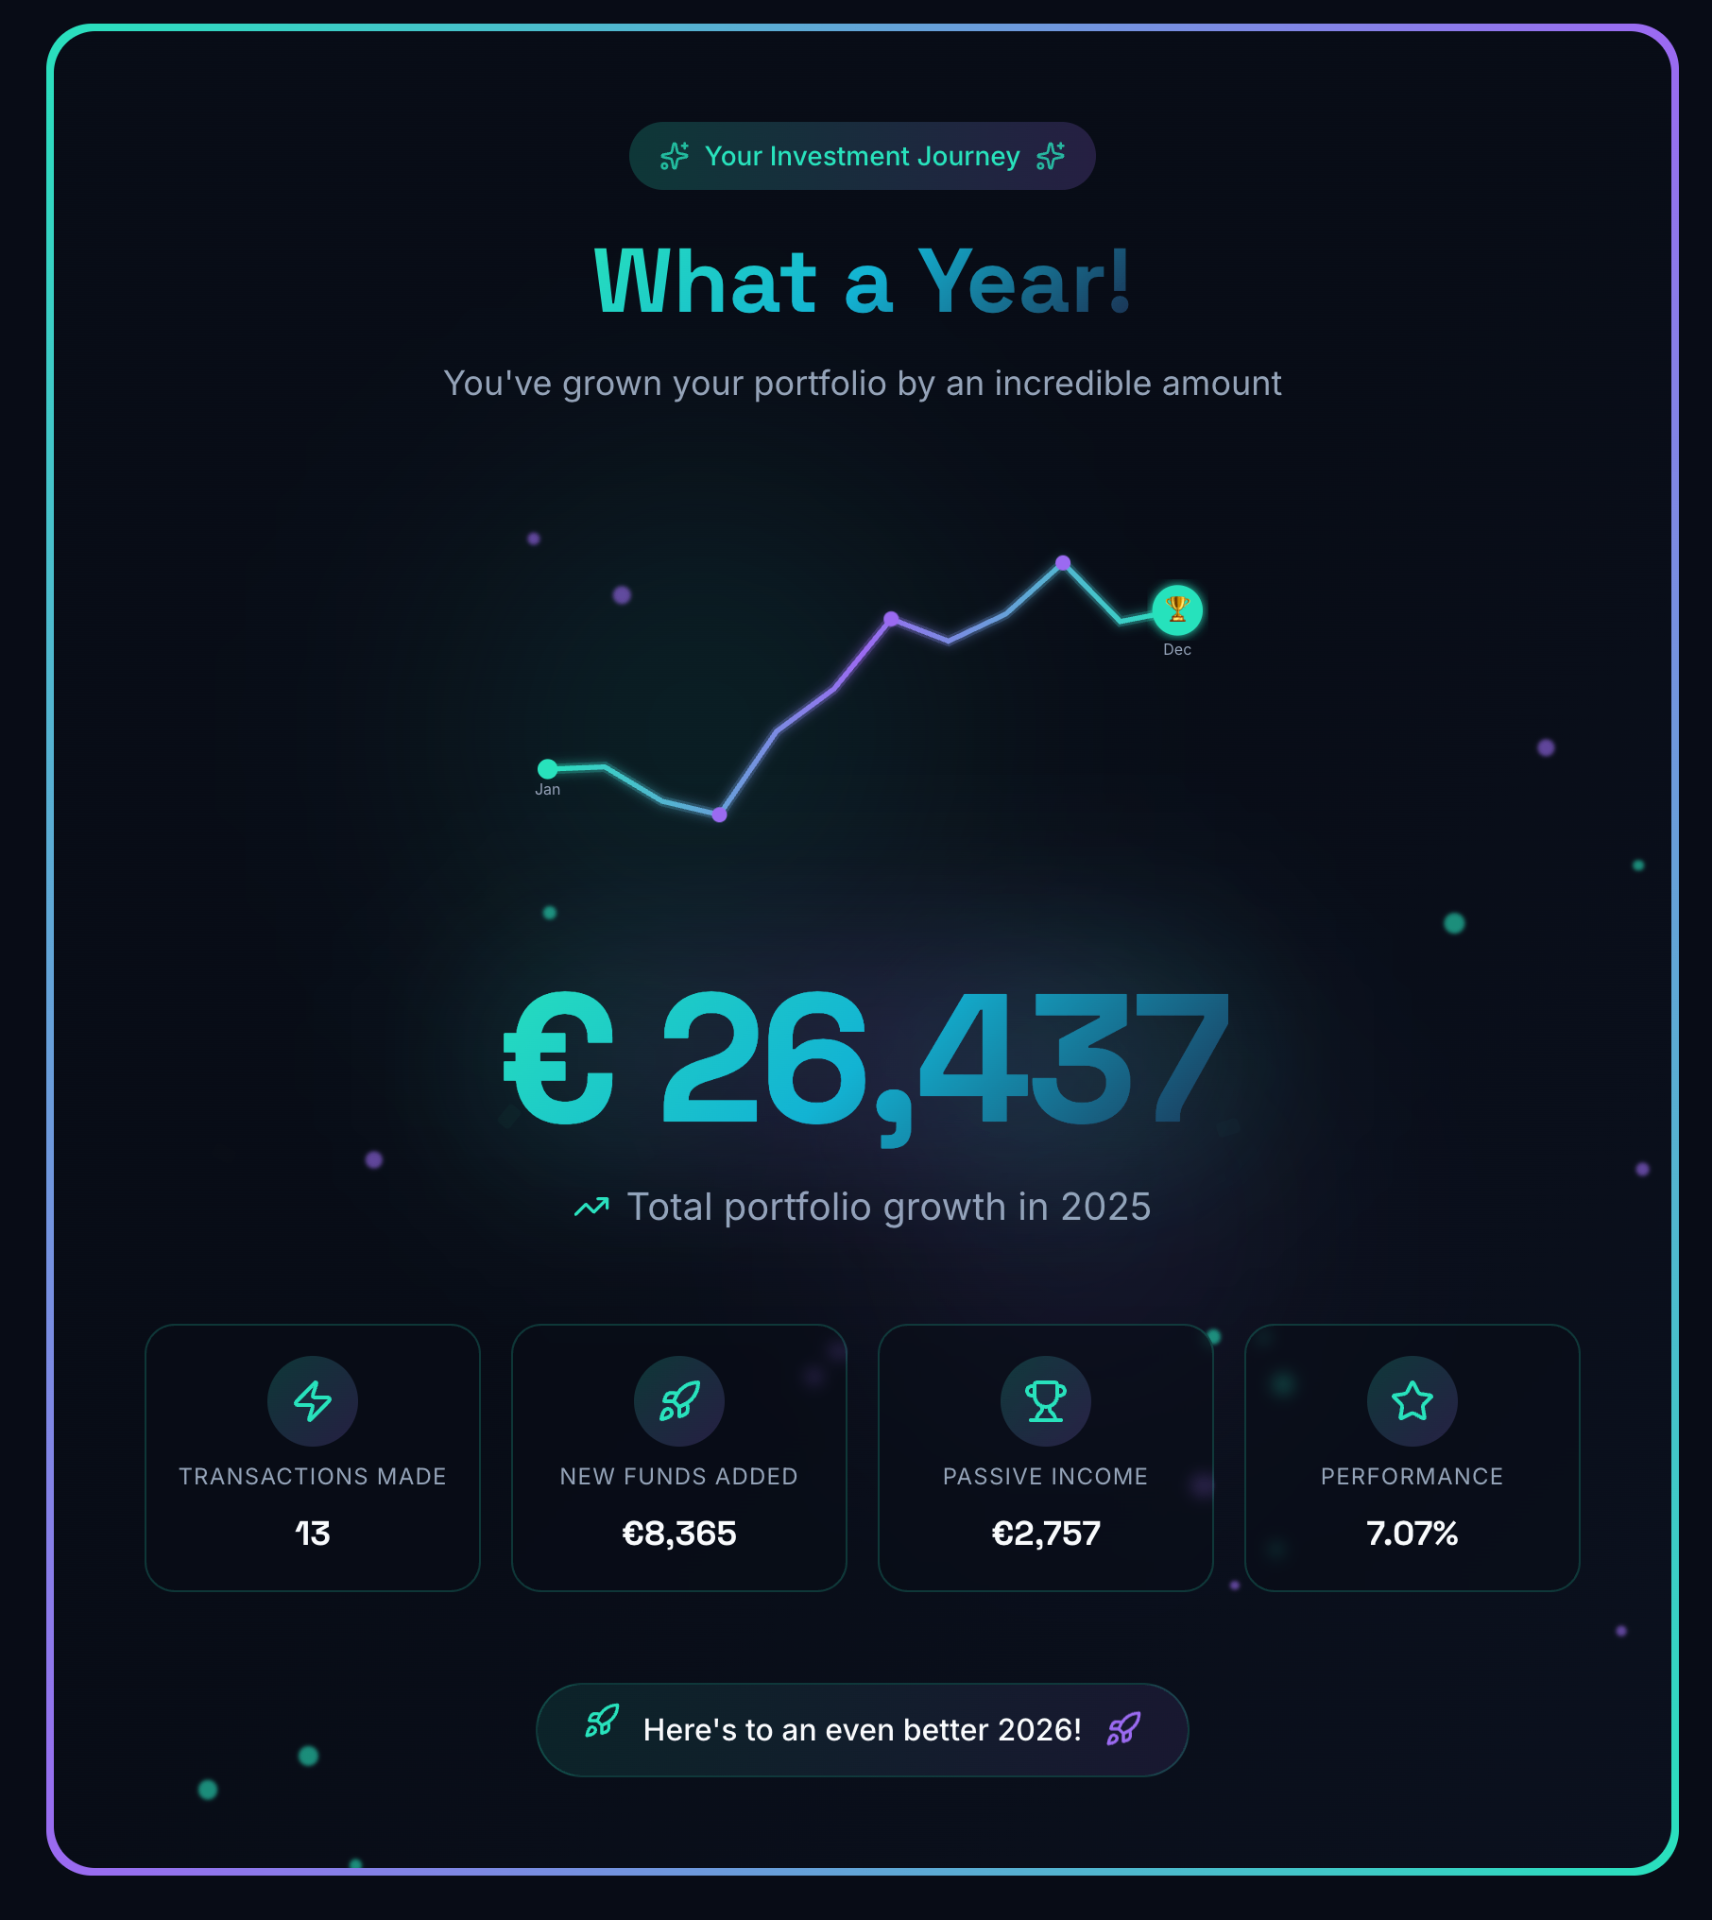
Year in Numbers
Your Annual Investing Wrapped — Beautifully
A closing balance is not a year. Year in Numbers turns twelve months of investing into a cinematic review: XIRR, benchmarks, passive income, best and worst months, allocation, activity, and a summary card worth sharing. The numbers do the emotional work.
Choose the report for the question in front of you
Each report has a job. Together, they turn your portfolio into a system you can inspect, compare, and plan around.
Composition
Where your capital actually sits.
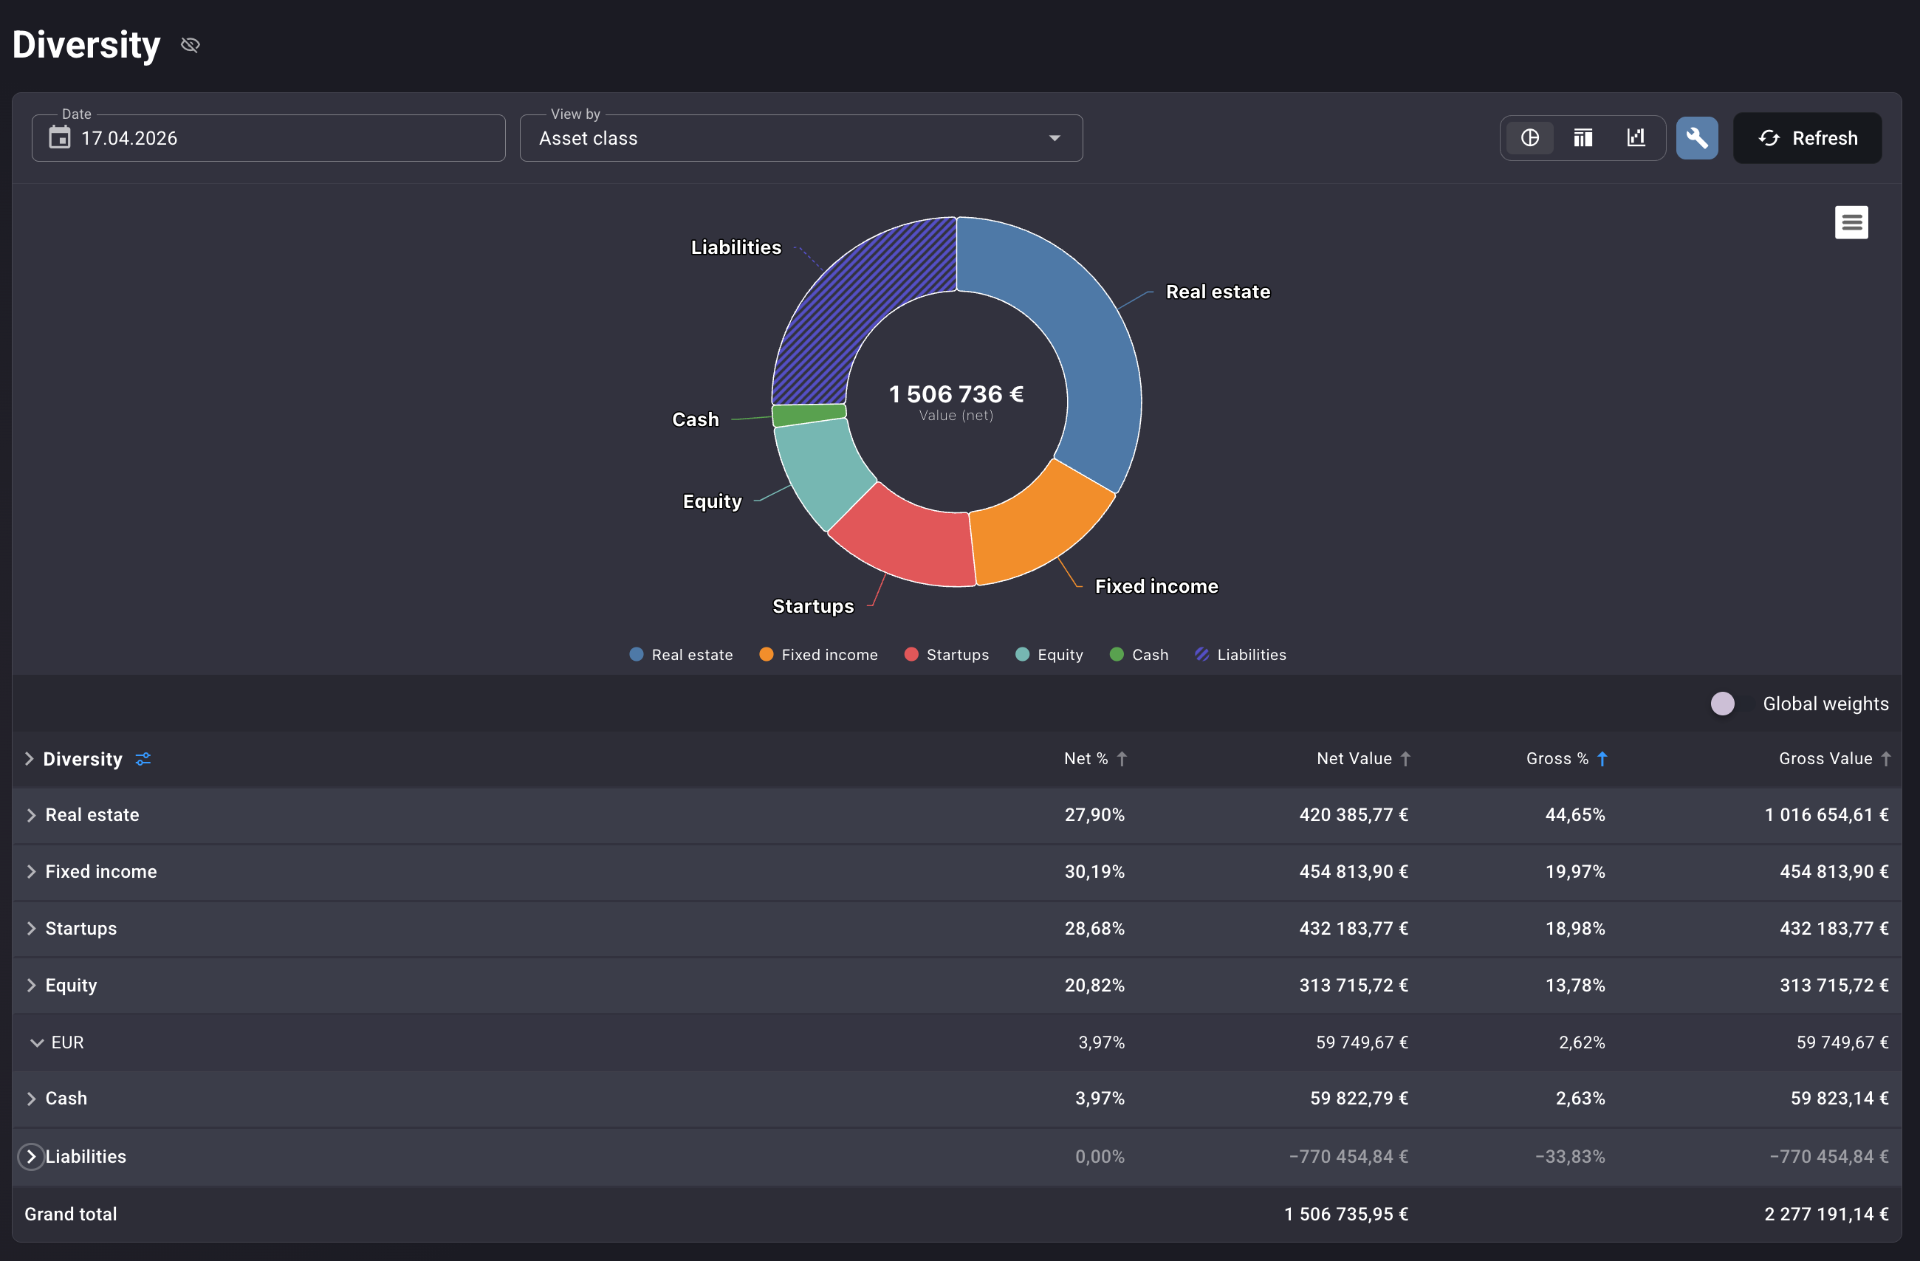
Diversity Report
Know Exactly Where Your Money Lives
- Net vs. gross percentage breakdown
- Drill-down from asset class to individual instruments
- Interactive donut chart visualization
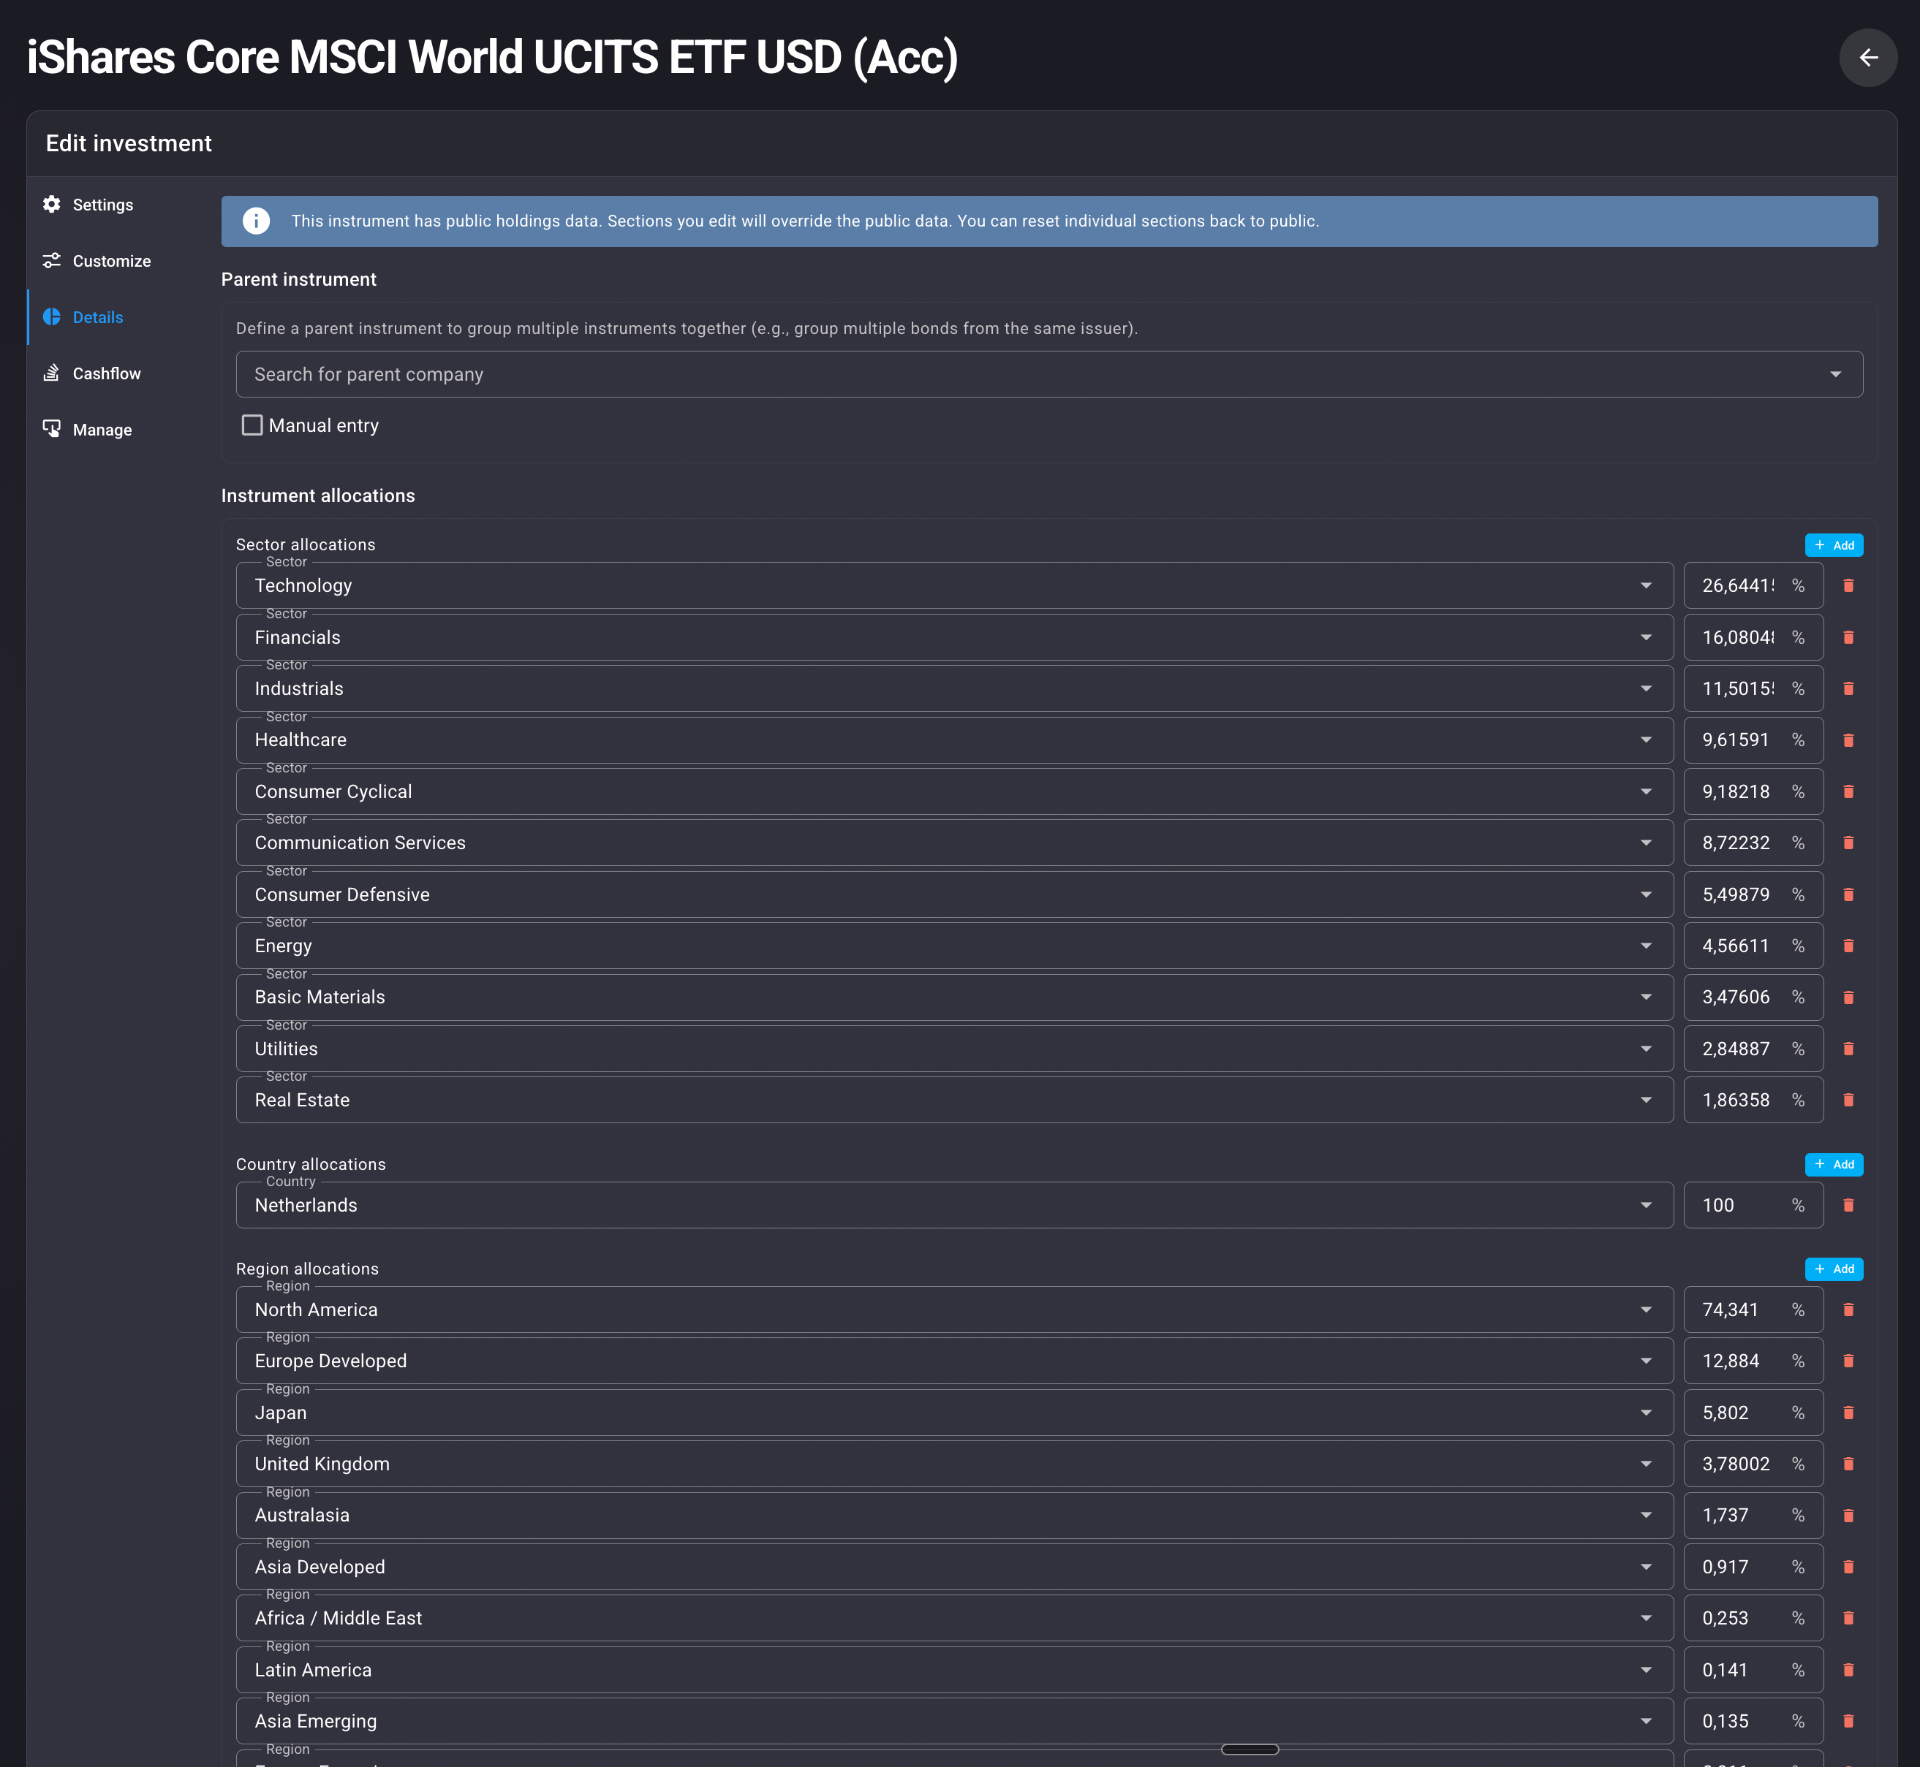
Investment Exposure Report
See Through the Funds to the Real Companies Underneath
- Drill-through ETF and fund holdings
- Consolidated company exposure across all funds
- Direct, Underlying, Residual, and Grouped tagging
Performance
What worked, what lagged, and what came from new capital.
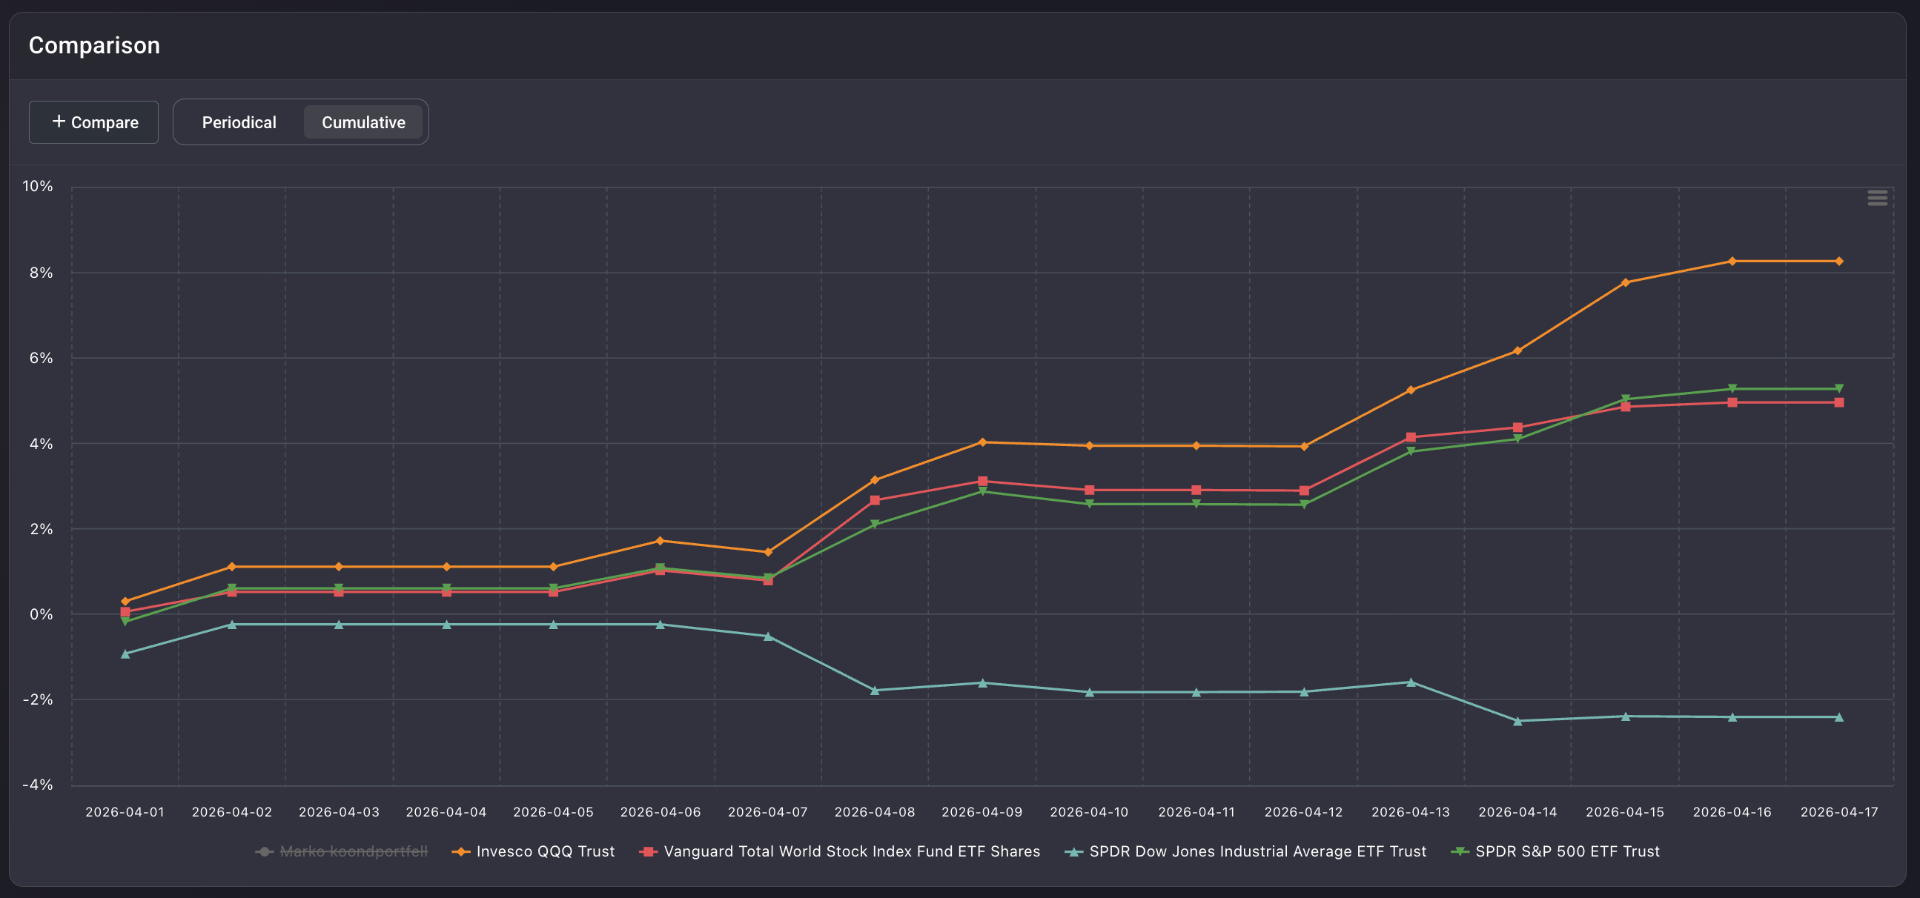
Portfolio Performance Report
Your Full Portfolio Return, Measured Properly
- Money-weighted (XIRR) return calculation
- Annualized and cumulative return metrics
- Volatility and maximum drawdown tracking
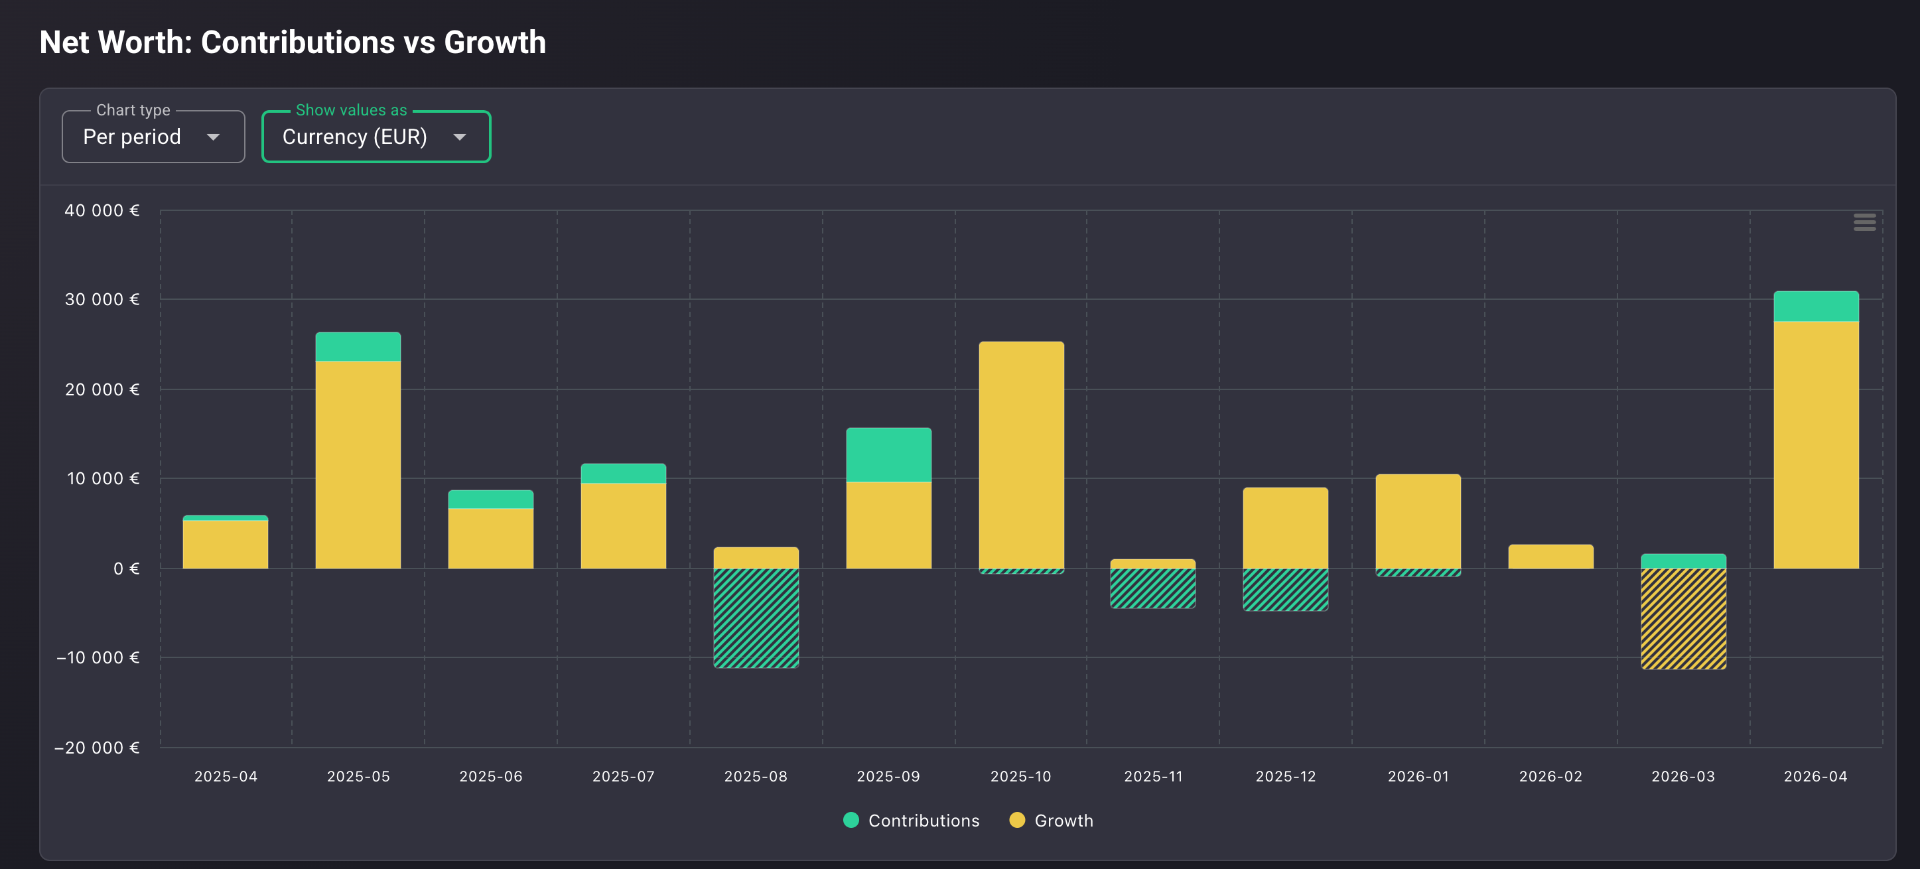
Contributions & Withdrawals Report
Separate What You Earned from What You Added
- Contributions vs. growth stacked visualization
- 12-month trailing average tracking
- Deposit streak detection
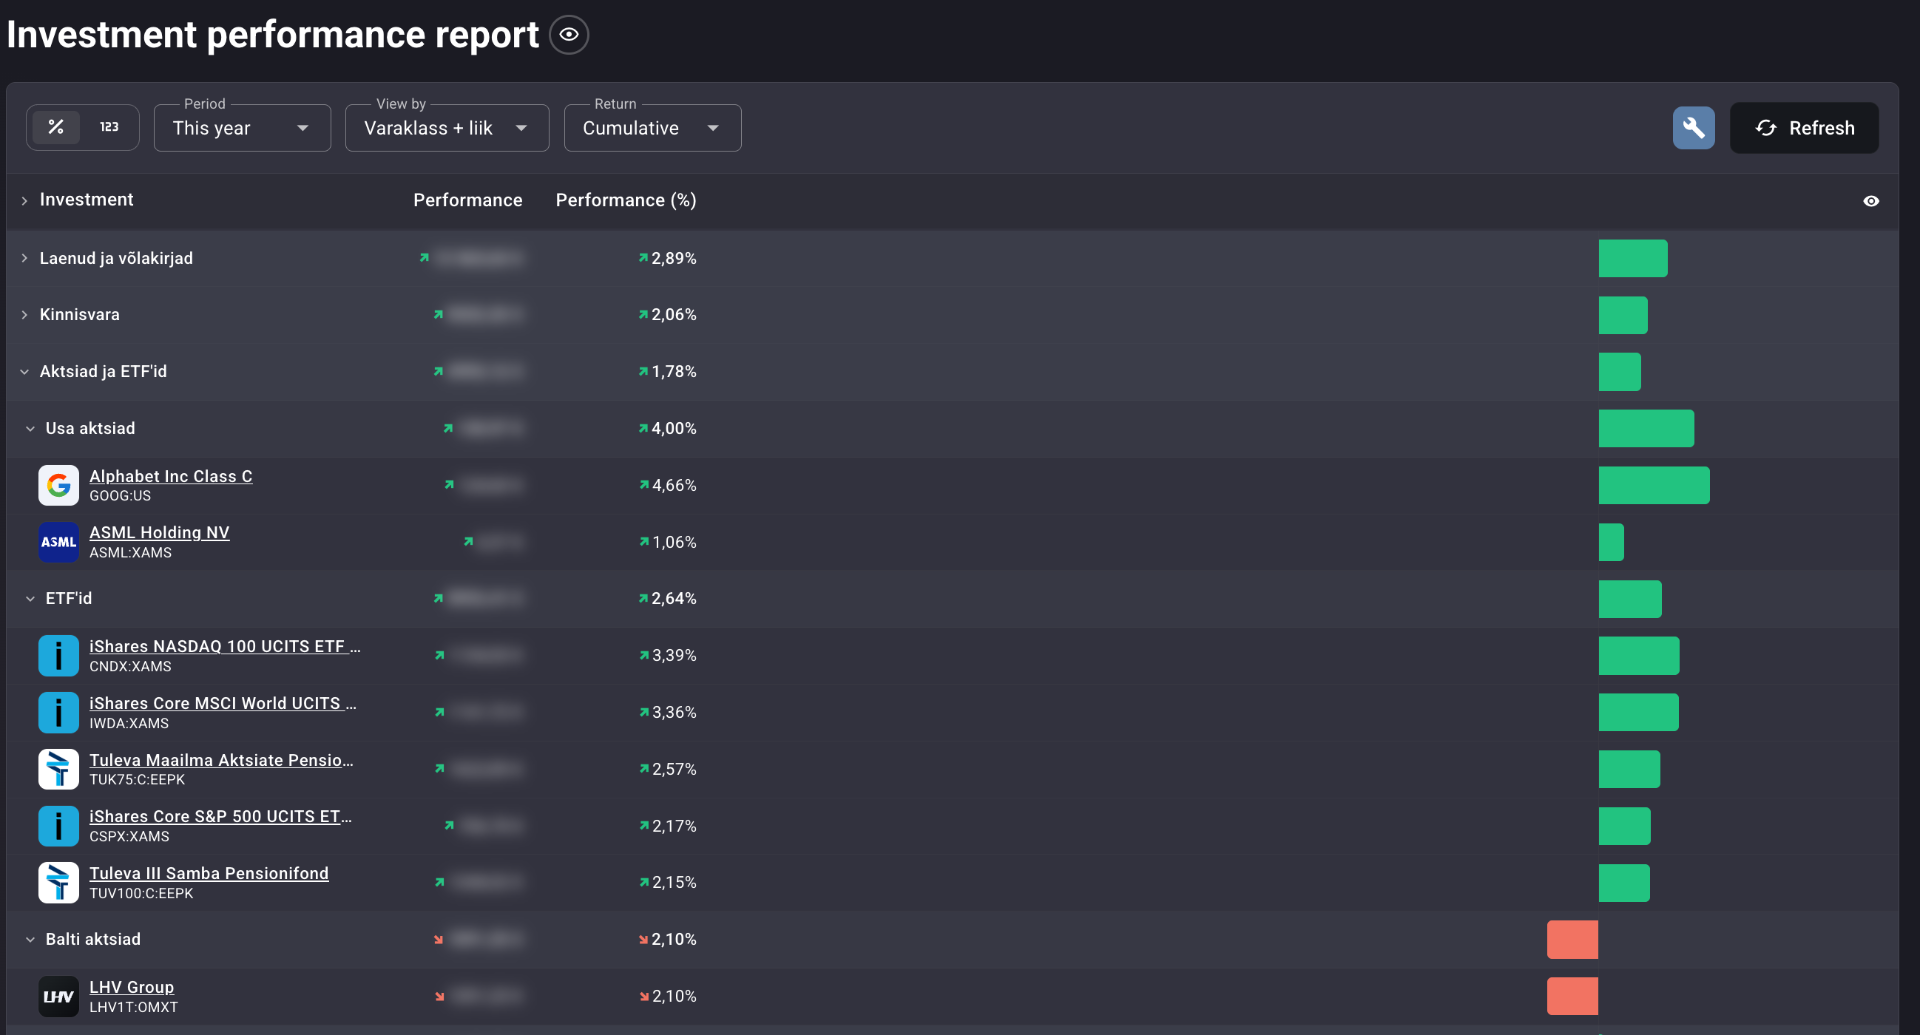
Investment Performance Report
Rank Every Holding by What It's Actually Returned
- Individual investment ranking by return
- Cumulative and annualized return views
- Horizontal bar chart for quick comparison
Future-looking
Cash flow, retirement, and the year-end story.
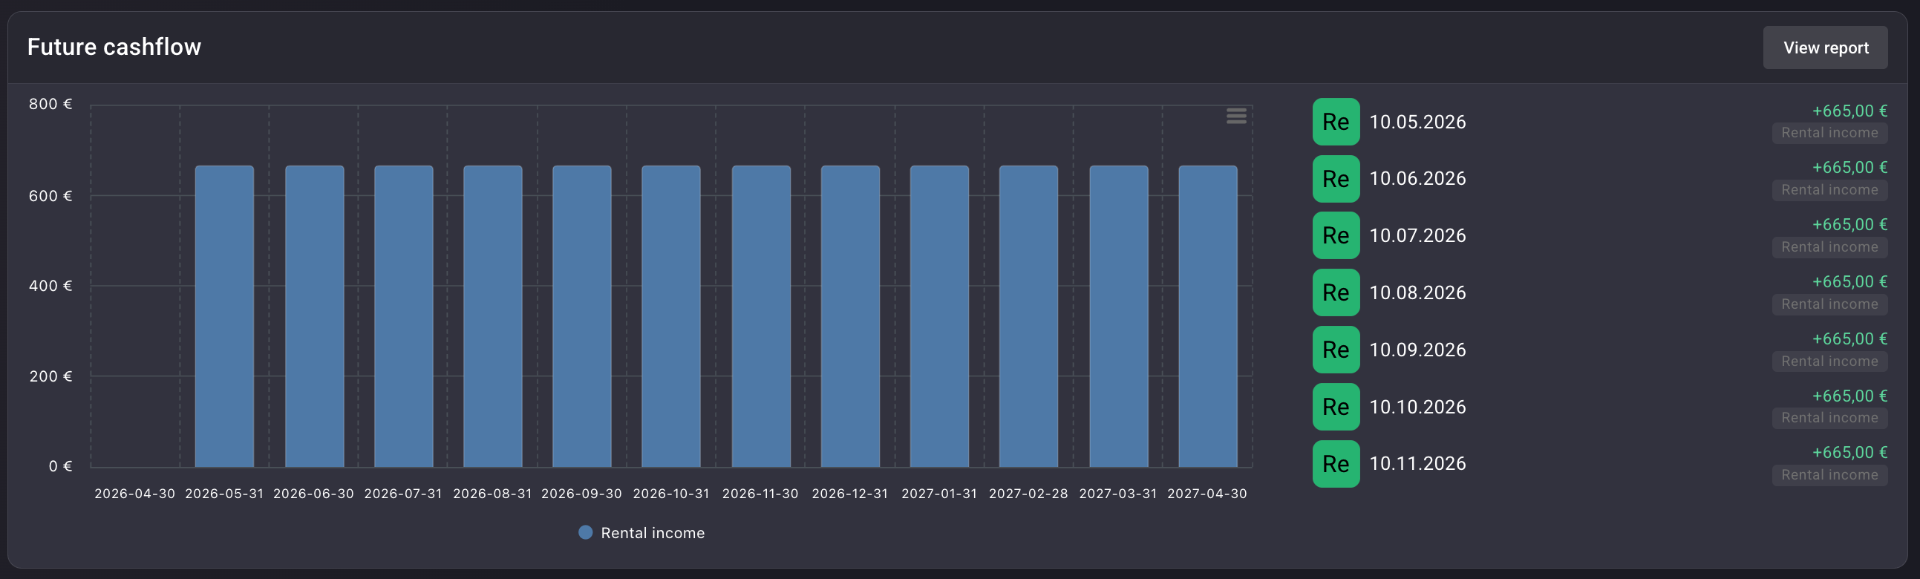
Future Cash Flow Report
Map Every Euro That's Coming In (and Going Out)
- Up to 5-year projection horizon
- Covers interest, principal, rental income, and liabilities
- Individual and aggregated cash event views
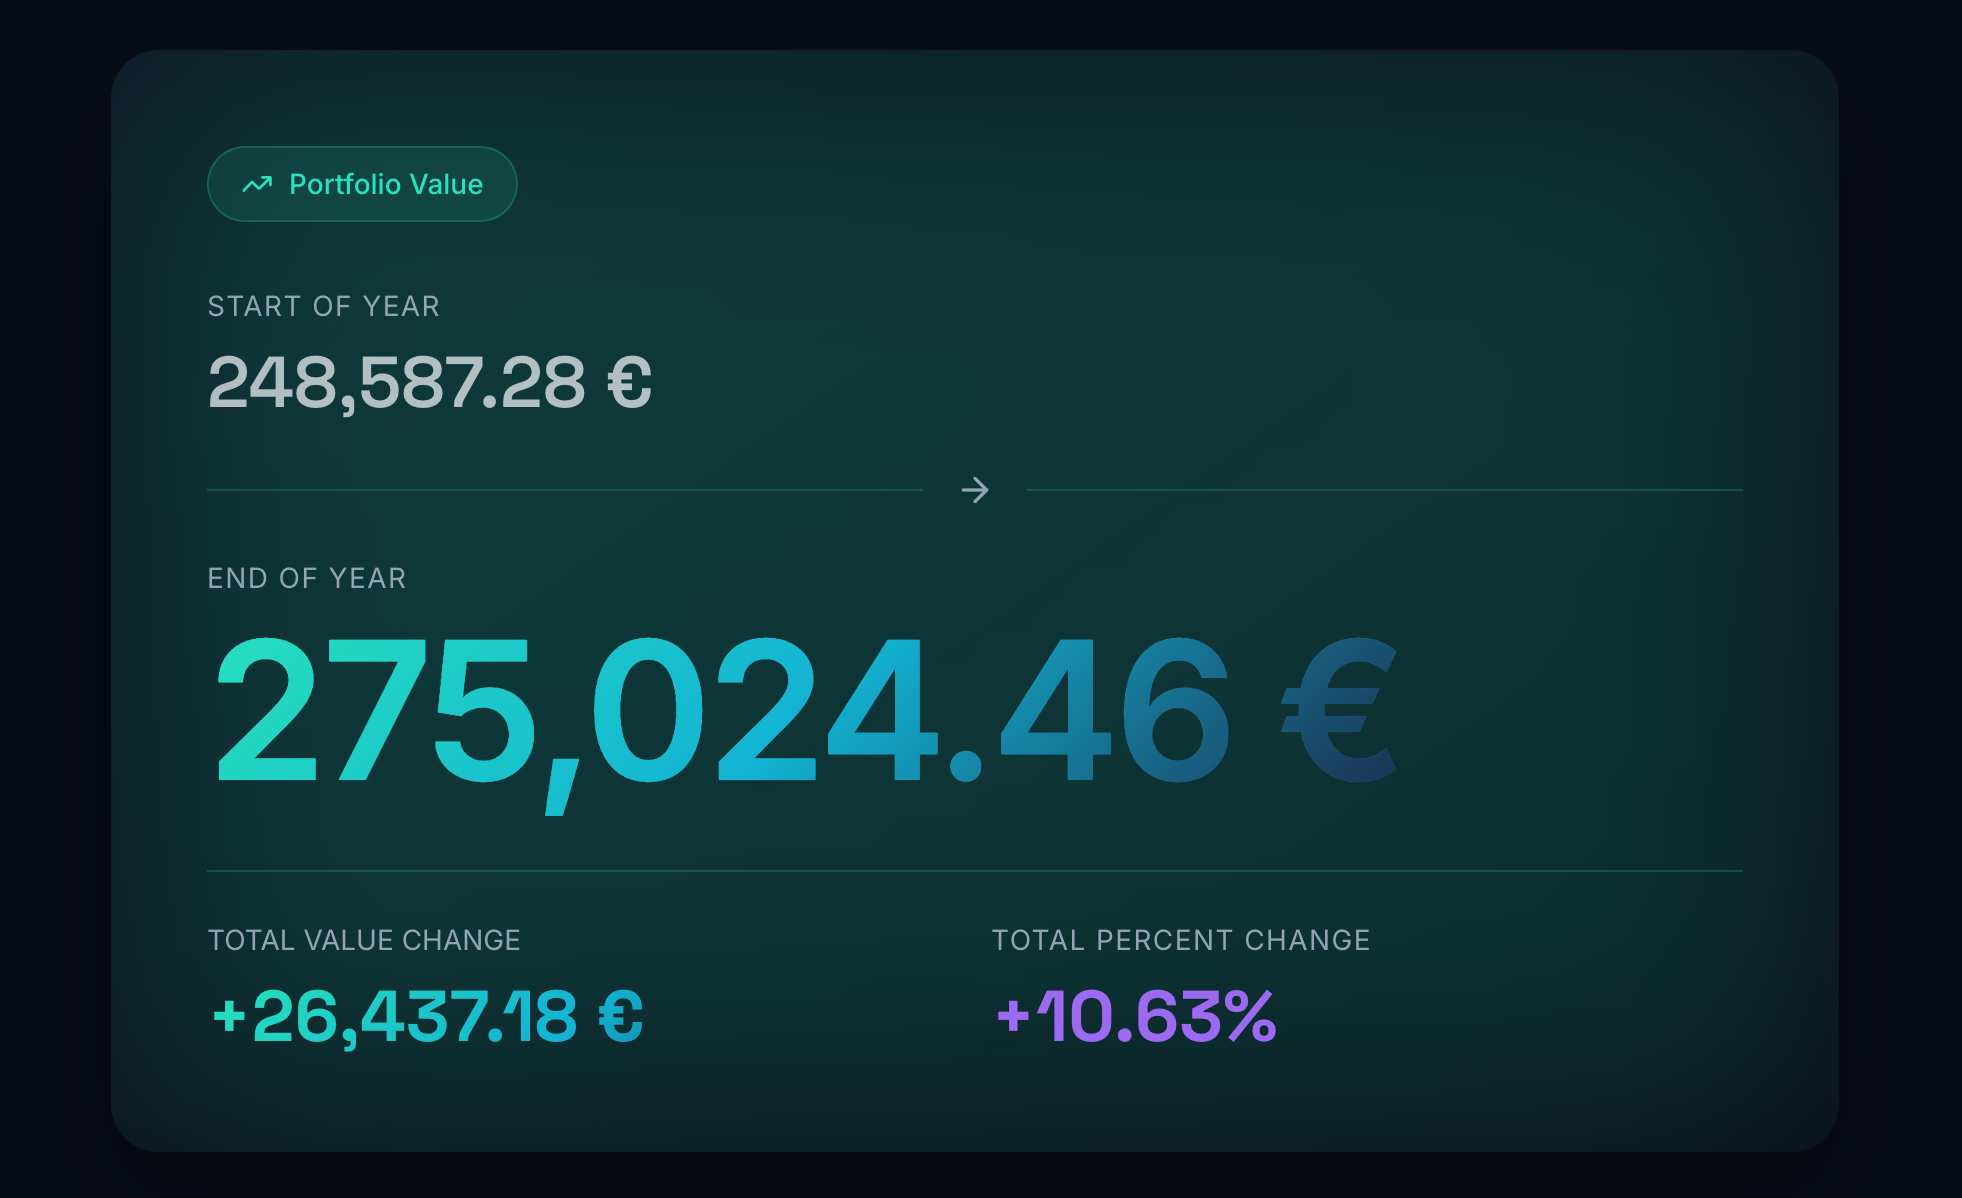
Year in Numbers
Your Annual Investing Wrapped — Beautifully
- Cinematic scroll-through annual summary
- Benchmark comparison with other users and indices
- Best and worst months and investments
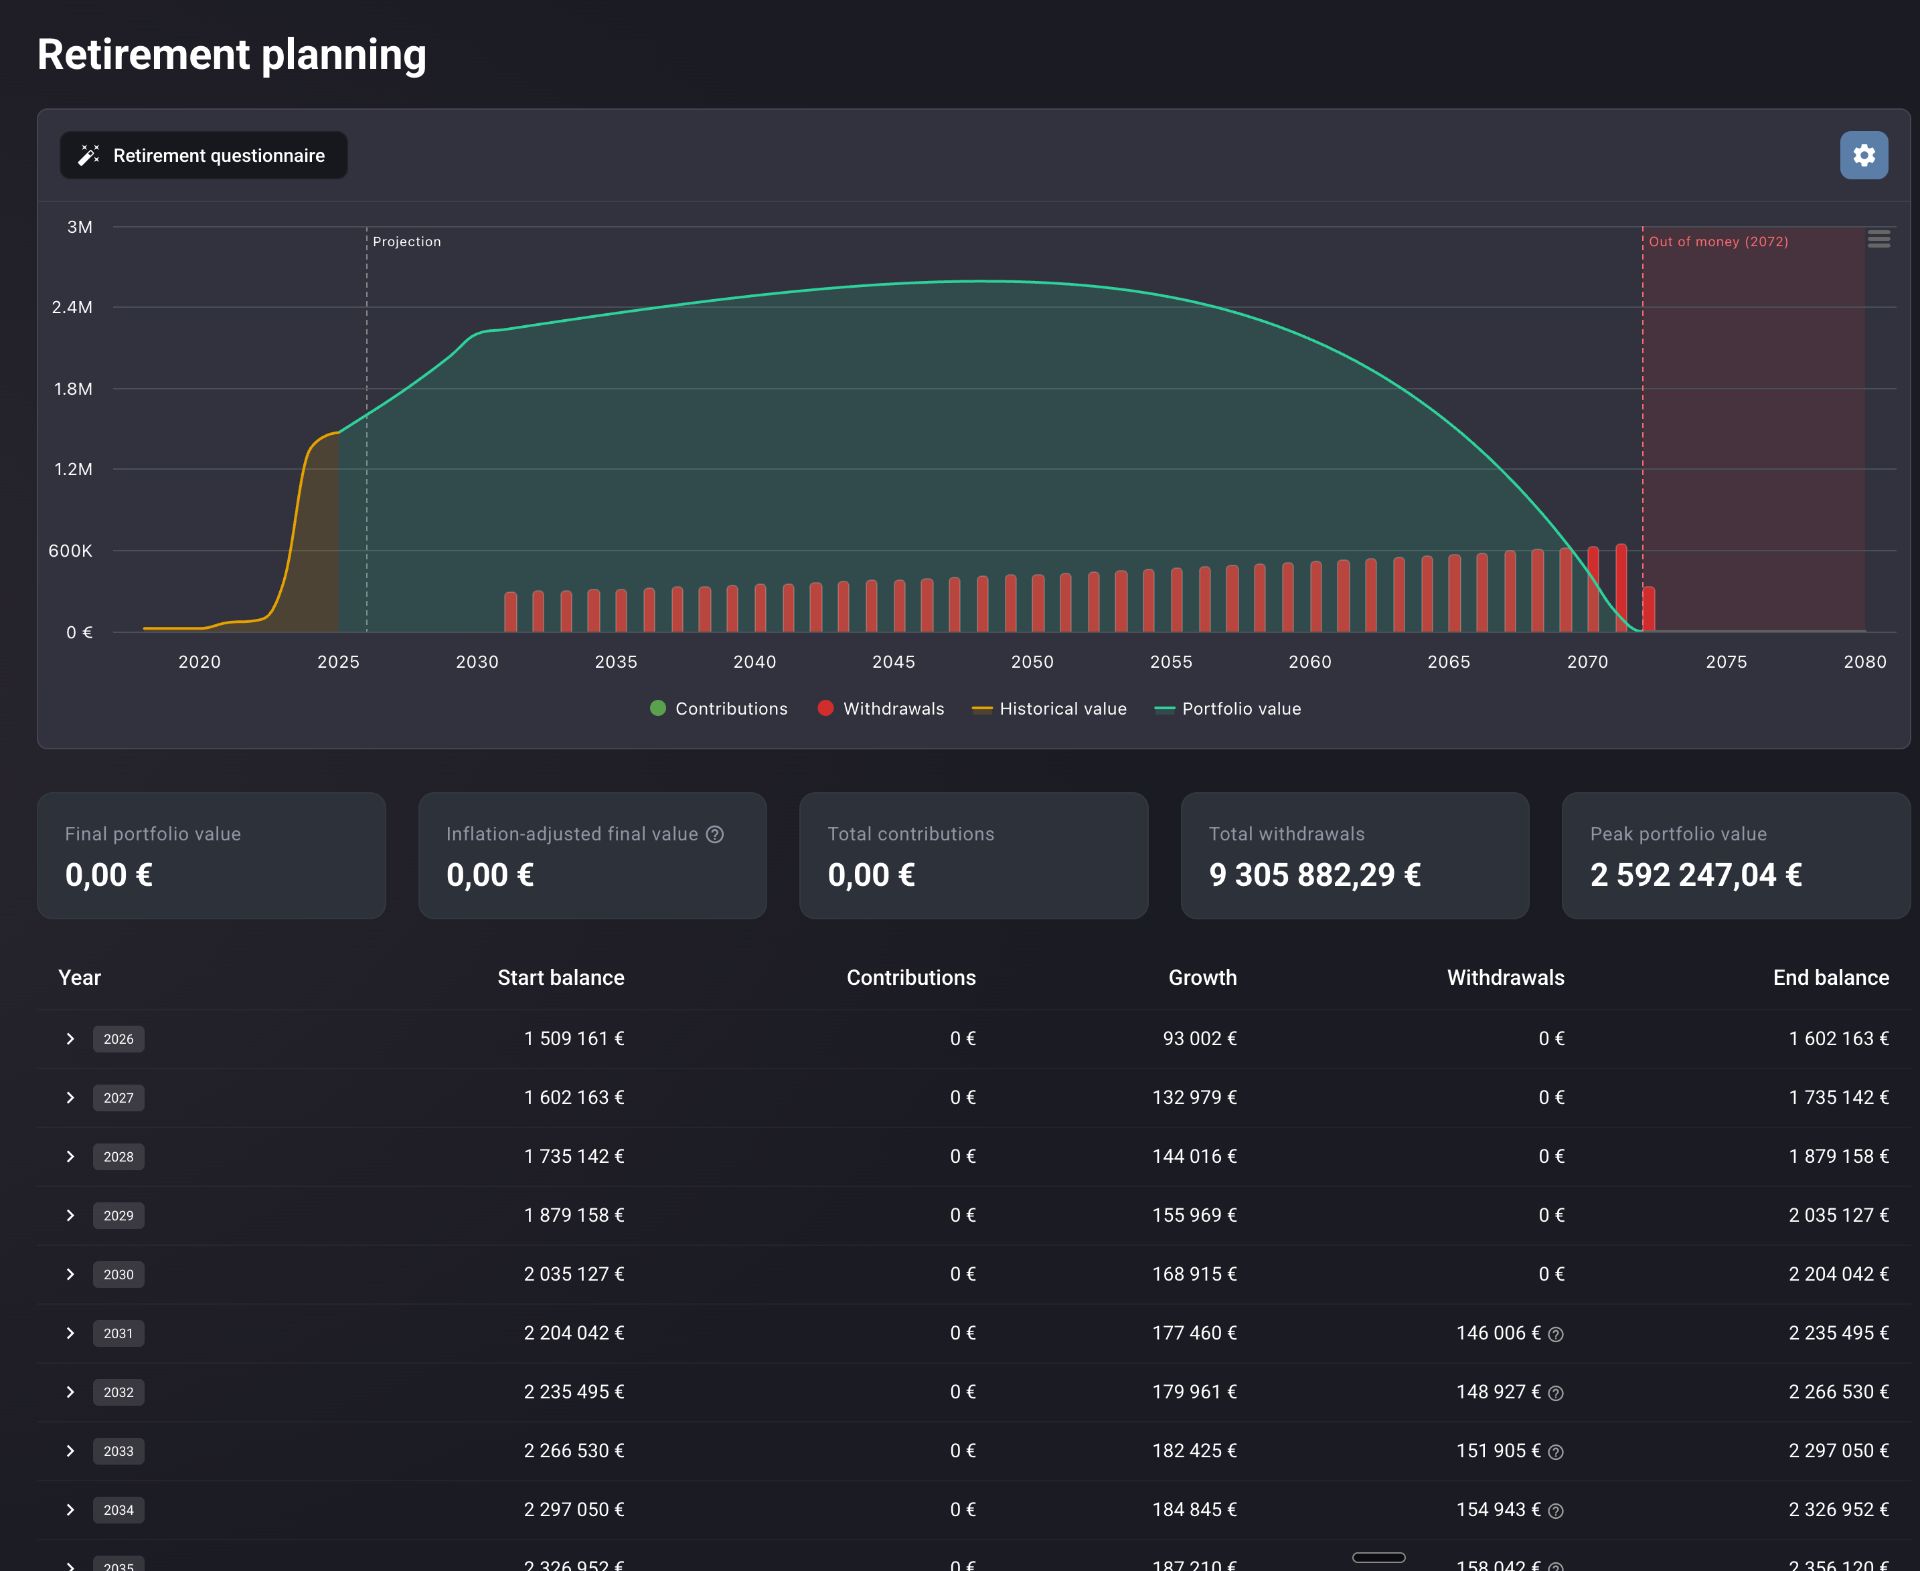
Retirement Planning Report
Project Your Portfolio All the Way to Retirement (and Beyond)
- Projection out to 2080
- Accumulation and drawdown phase visualization
- Retirement questionnaire for personalized inputs
Operational
The source ledger behind every number.
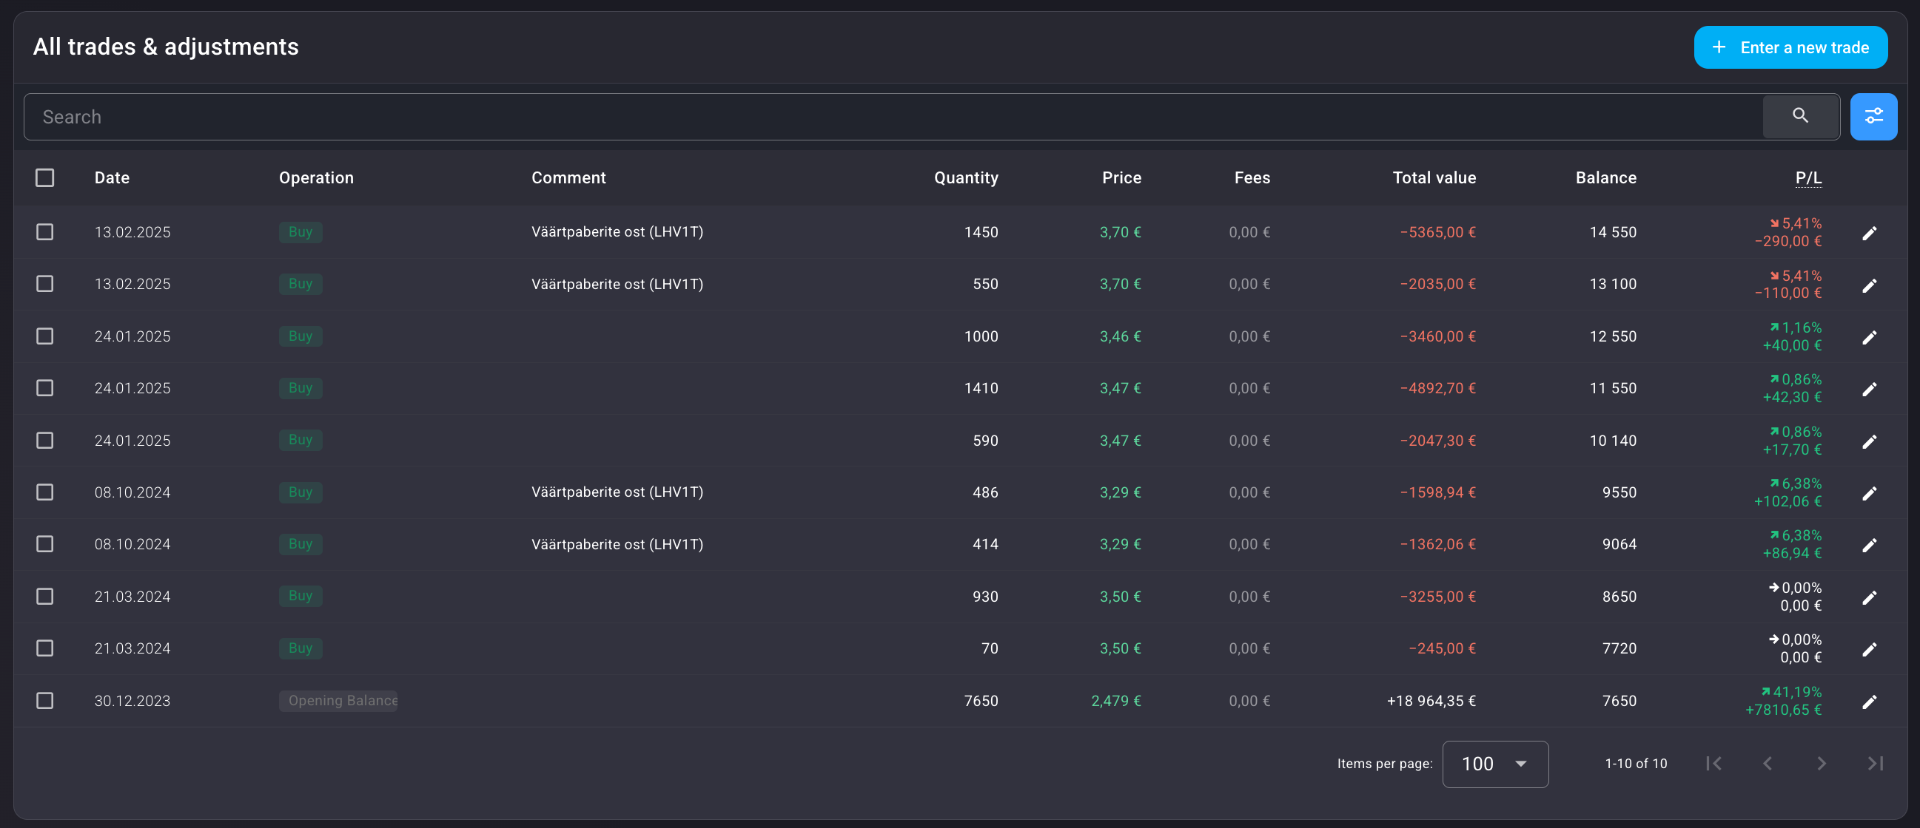
Anchored to your real portfolio
Every report starts from your own holdings, transactions, accounts, and cash flows.
Money-weighted by default
XIRR keeps deposits and withdrawals from disguising your actual investment return.
Built for messy portfolios
Stocks, ETFs, real estate, bonds, loans, liabilities, crypto, and cash sit together.
Report questions, answered
Are Portfellow reports included in every plan?
Reports are available across Portfellow plans, with advanced report access depending on your subscription. The pricing page shows exactly which plan includes which reports.
Can I export a report?
Some reports support exports for record-keeping, including transaction data. Year in Numbers also creates shareable summary visuals for your annual review.
How fresh is the data inside each report?
Reports update from the portfolio data you maintain in Portfellow, including synced accounts, imported trades, manual entries, and recorded cash flows.
Can I compare my portfolio against benchmarks?
Yes. Performance-focused reports include market context such as S&P 500, Nasdaq, MSCI World, and peer comparisons where relevant.