Owning twenty investments isn't the same as knowing which three are doing the work
The Investment Performance Report ranks every holding you own — stocks, ETFs, bonds, funds, real estate, pension instruments, and cash — on the same basis, for the same period, in a single view. Sort, group, and switch between cumulative and annualized return in one click.
For investors with genuinely mixed portfolios
If your holdings span more than one asset class — and you've never seen them ranked side by side, on the same return basis — this report is for you.
Multi-asset portfolio holders
You hold equities and at least one of: bonds, funds, real estate, pension instruments, or loan-based investments. No single platform has ever ranked them together.
Anyone with a bond ladder or rental property
Your fixed-income and real-estate returns sit in spreadsheets, separate from your equity broker. You've never seen a clean side-by-side comparison.
Investors approaching a rebalance
Before adding capital or trimming, you want a ranked, honest view of which holdings deserve more — and which deserve scrutiny.
"Is this bond actually worth holding?"
You've asked the question. Comparing a 3.6% bond return to a 48% equity return without one consistent methodology is meaningless. You need it on one screen.
A diverse portfolio you can't actually compare
Holding twenty investments is not the same as knowing which three are responsible for most of the return — or which two are quietly dragging it down.
Brokers only rank what they hold
A stock broker shows you equity returns. A bond platform shows you bond returns. Neither shows you everything ranked together. The full picture lives nowhere.
Different methodologies, no common basis
Two platforms, two return calculations, two windows. Putting a stock\'s 48% next to a bond\'s 3.6% only means something if both numbers were calculated the same way.
Holdings of different ages distort cumulative %
A position held for 18 months and one held for 3 years can't be compared on cumulative return alone. You need annualized — switchable from one toggle, not buried in a spreadsheet.
FX effects masquerade as performance
A USD holding looks brilliant in EUR-denominated terms. How much was the asset, and how much was currency? Without isolating it, you can't tell.
The result: allocation decisions get made on gut feel rather than evidence.
How the Investment Performance Report solves this
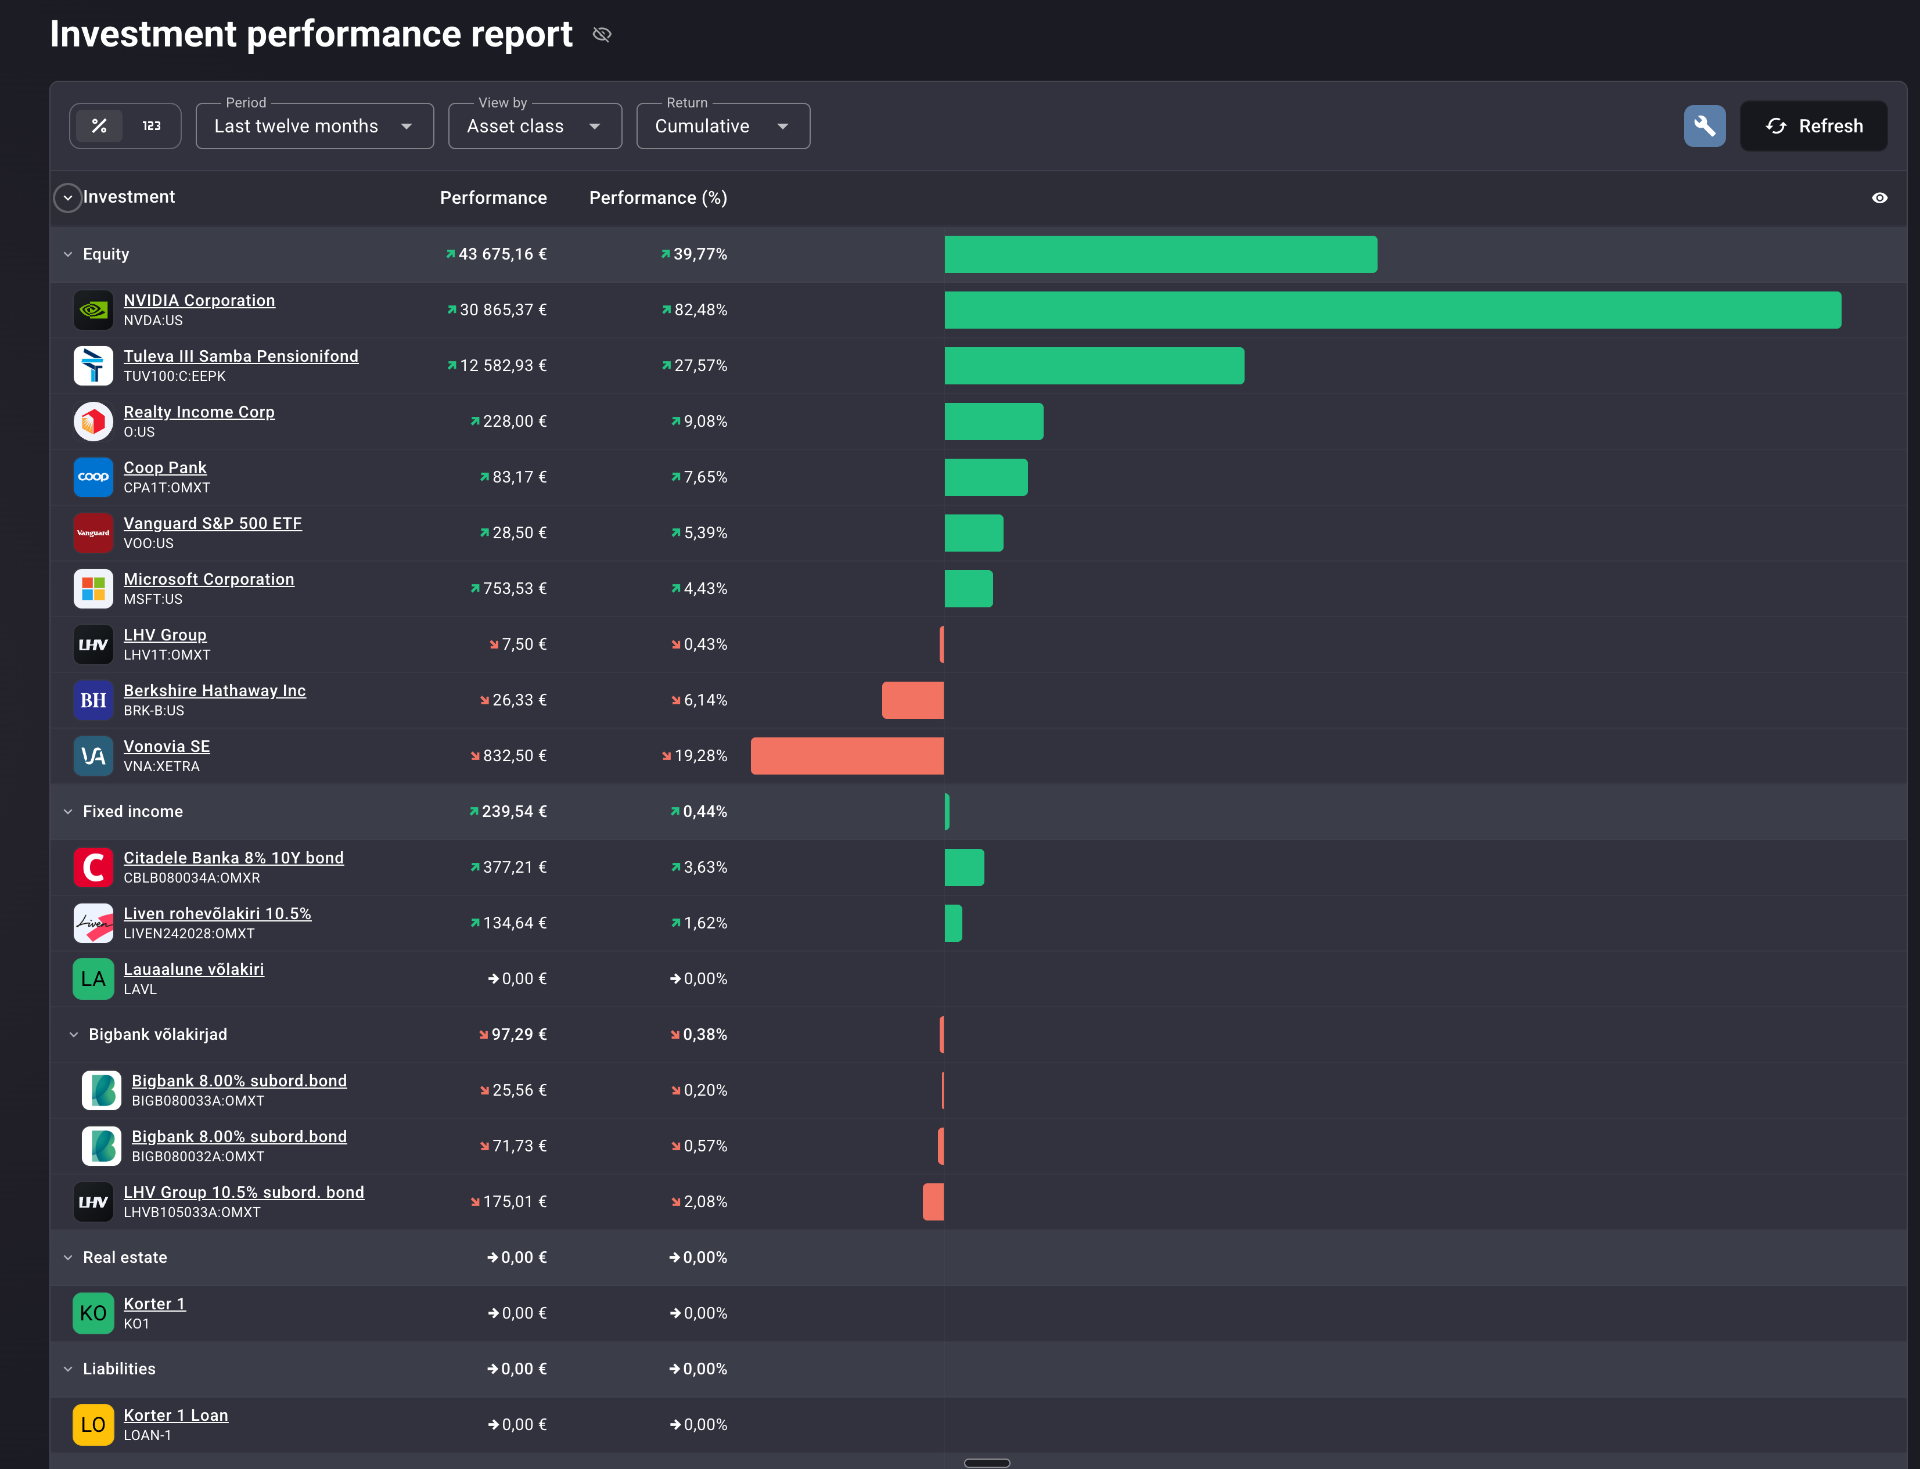
One ranked table. Every asset class. Same basis, same period. The widest green bar is your top performer. The widest red bar is the one you need to look at.
Every holding, ranked together for the first time
NVIDIA, a Tuleva pension fund, a Citadele subordinated bond, a rental property, and a cash account — all in one table, sorted by return, with horizontal bars scaled to the top performer. Green for positive, red for negative. The ranking is visible at a glance, before you read a single number.
Two return modes. One toggle.
Cumulative return shows total gain or loss over the selected period — useful for comparing holdings over the same window. Annualized expresses return as a yearly rate — essential for comparing holdings held for different lengths of time on a common footing. Switch between them in one click. Both modes show absolute monetary gain alongside the percentage.
Asset class, instrument type, currency, or portfolio
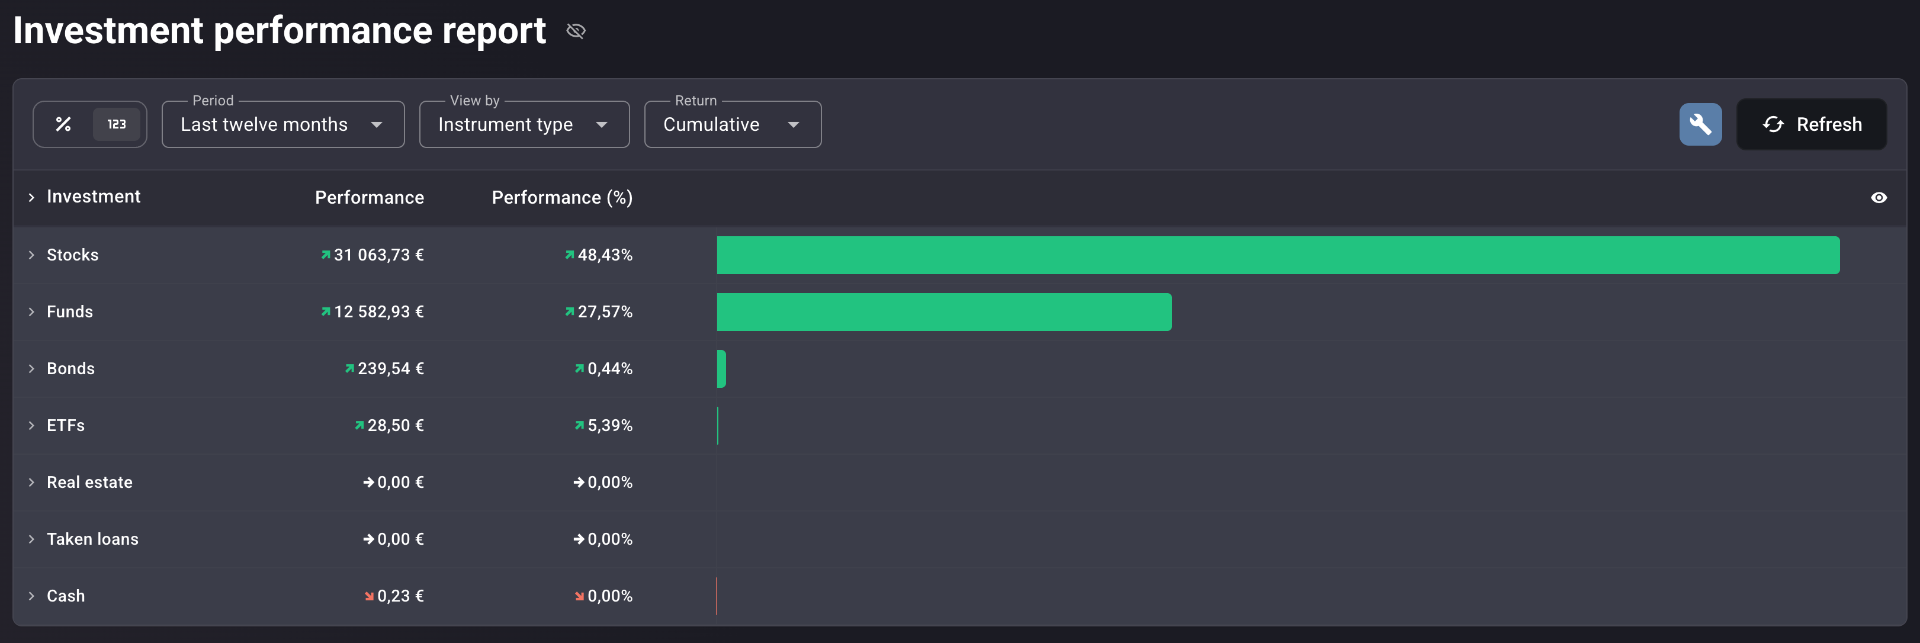
A single dropdown re-groups the entire ranking. Asset class shows Equity vs. Fixed income vs. Real estate. Instrument type breaks Equity into Stocks, Funds, and ETFs. Currency isolates FX exposure. Portfolio compares your personal account against a company holding. Each grouping is collapsible, with a group-level aggregate return and the individual holdings underneath.
Bars that rank for you
Every row — group header and individual holding — has a horizontal bar proportional to its return. Bars are scaled relative to the best performer in the current view, so the chart is the ranking. A toggle switches the leading column between percentage and absolute monetary figures, depending on whether you think in % or in €.
Four views. One ranked table.
The same holdings. The same period. The same return methodology. Switch the lens to answer a different question.
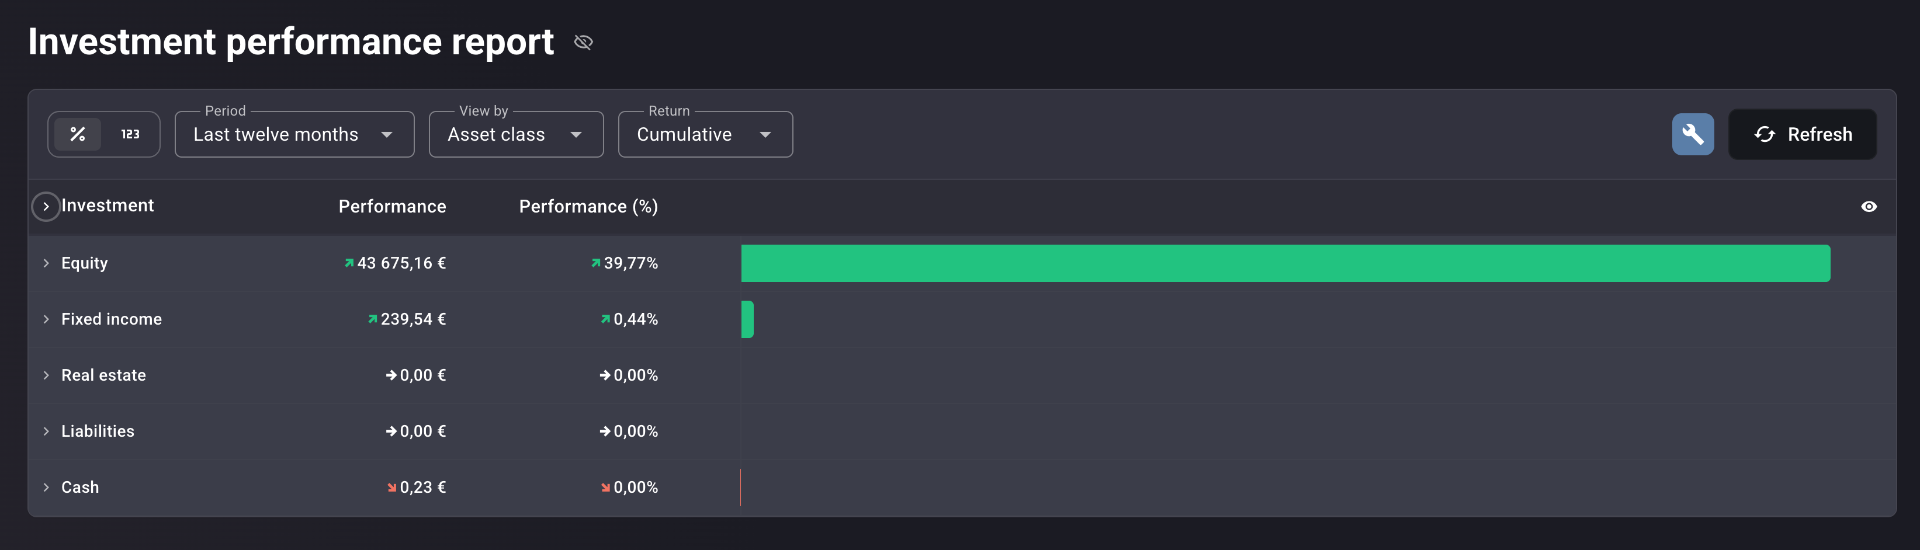
Group by Asset class to see Equity vs. Fixed income vs. Real estate vs. Liabilities vs. Cash. Aggregate return per asset class on top, individual holdings expandable beneath. The fastest way to see which category is leading and which is lagging.
Built to rank what you actually own
Unified holding-level ranking
Every equity, ETF, fund, listed bond, unlisted bond, real-estate position, taken loan, and cash account in a single ranked table.
Cumulative + annualized toggle
Switch between total return over the period and yearly-rate return in one click. Compare like with like, regardless of holding age.
Absolute and percentage columns
Every row shows monetary gain or loss in portfolio currency next to the percentage figure. Group rows show the aggregate.
Four "View by" groupings
Asset class, Instrument type, Currency, and Portfolio. Each collapsible, each with group-level aggregate returns.
Horizontal bar ranking
Green for positive, red for negative, scaled to the top performer in the current view. The chart is the ranking.
% / numeric primary toggle
Lead with percentage or with absolute monetary figures, depending on how you prefer to think.
Multi-currency with FX included
Foreign-currency holdings convert to portfolio currency. The Currency grouping isolates how much of the return is asset vs. FX.
Sub-portfolio grouping
Investors managing a personal account and a company holding can compare aggregate returns across entities, then drill in.
Configurable period
Last month, last twelve months, year-to-date, or any custom date range. Switching the period instantly re-ranks every holding.
Real-life use cases
Equity 39.77% vs. Fixed income 0.44%
Switch View by to Asset class. Equity returned 39.77% cumulative over the last twelve months. Fixed income returned 0.44%. The first time those two numbers have ever sat in one screen — and the question of whether to add more bonds or redirect capital to equities now has a factual starting point.
USD 55.60% vs. EUR 6.77%
Switch to Currency grouping. USD-denominated holdings returned 55.60% in portfolio-currency terms. EUR holdings returned 6.77%. A significant portion of the USD outperformance is FX, not the underlying assets — a risk you had not consciously quantified until now.

NVIDIA 82.48% vs. Vonovia -19.28%
Switch Return to Annualized, expand the Equity group. NVIDIA: 82.48%. Vonovia SE: -19.28%. A side-by-side comparison that immediately focuses the rebalancing conversation on one holding in particular.
Fits the way you actually invest
Core-satellite investors
See whether the satellite positions are generating the excess return that justifies holding them alongside a low-cost core.
Income investors
Bonds and real estate ranked against equities on a total-return basis — not just by yield.
Multi-currency investors
Separate FX effects from underlying asset performance using the Currency grouping view.
Multi-entity investors
Personal account and company holding ranked side by side — aggregate returns compared, then drilled into.

Everything ranked. On the same basis. In one view.
Most platforms rank your holdings within a single asset class, on a single platform, using a methodology they don't always explain. Portfellow ranks everything — stocks, bonds, funds, real estate, pension instruments, and cash — on the same basis, for the same period, in the same view.
Switching between cumulative and annualized return is one click. Grouping by currency to isolate FX effects is one dropdown. Seeing your personal portfolio and your company holding side by side is built in. The horizontal bars mean you don't need to read every number — the ranking is visible at a glance. No spreadsheet, no platform-switching, no methodology guesswork.
Suggested workflow
Ten steps from "I think these are working" to "I know exactly which holdings deserve more capital — and which deserve scrutiny."
Add every holding
Stocks, ETFs, funds, listed and unlisted bonds, real estate, pension instruments, loans, and cash — across every account.
Open the report
Investment Performance loads with every holding ranked, on the same basis.
Set the period
Last twelve months for an annual review, year-to-date for a mid-year check, or a custom range.
Start with Asset class
See aggregate return per asset class. Identify the leader and the laggard.
Expand each group
See individual holdings ranked within each asset class.
Switch to Annualized
If holdings have been held for different lengths of time, switch the Return toggle for a fair comparison.
Toggle Instrument type
Find out whether the drag is coming from a specific instrument category — ETFs vs. stocks vs. bonds.
Switch to Currency
Separate asset returns from FX effects.
Switch to Portfolio
Compare aggregate returns across personal and company sub-portfolios.
Cross-reference Portfolio Performance
Confirm the impact on total money-weighted return before you act.