Knowing money is coming in isn't the same as knowing when it lands
Holding bonds, rentals, and loans tells you income exists somewhere in the portfolio. The Future Cash Flow Report tells you the date, the instrument, the amount, and how it nets against everything you're paying out — for the next five years, on one screen.
For investors who plan around income
If you've ever tried to reconstruct next year's income from broker statements, a spreadsheet, and memory — this is the report you've been building by hand.
Bond holders with multiple issues
Different coupon dates, different maturities, scattered across two or three platforms. The full payment schedule lives nowhere as a single list.
Property investors with mortgages
Rental income on one side, mortgage interest on the other. The headline yield is meaningless until they sit on the same chart.
Crowdfunding & loan investors
Many small contracts, each with its own repayment schedule. Tracking them individually is a part-time job.
Anyone reconstructing from memory
You\'ve copied dates into a spreadsheet, looked up coupons in PDFs, and still missed a repayment. There is a better way.
Income exists. The calendar doesn't.
Brokers can tell you what you hold. Almost none can tell you, in one view, when every euro arrives — or what it will cost to get it.
Brokers show yield, not a calendar
Current yield and maturity date — useful, but not a schedule. There is no unified view of every coupon, every repayment, and every rental payment laid out in time.
Six bonds, four platforms — only in your head
The next twelve months of coupon payments exists nowhere as a single list. You hold the schedule from memory, or you don\'t hold it at all.
Principal repayments arrive in lump sums
Irregular, large, and demanding a reinvestment decision the moment they hit. Without warning, they arrive as a surprise — and the cash sits idle.
Rental yield is meaningless without the mortgage
A 6% gross yield on a property looks fine until you net off the interest you're paying out. Without seeing both, you're reading half the picture.
How the Future Cash Flow Report solves this
A dated ledger, a periodical chart, a cumulative trajectory, and the filters that let you isolate any single stream.
A dated ledger, not a vague forecast
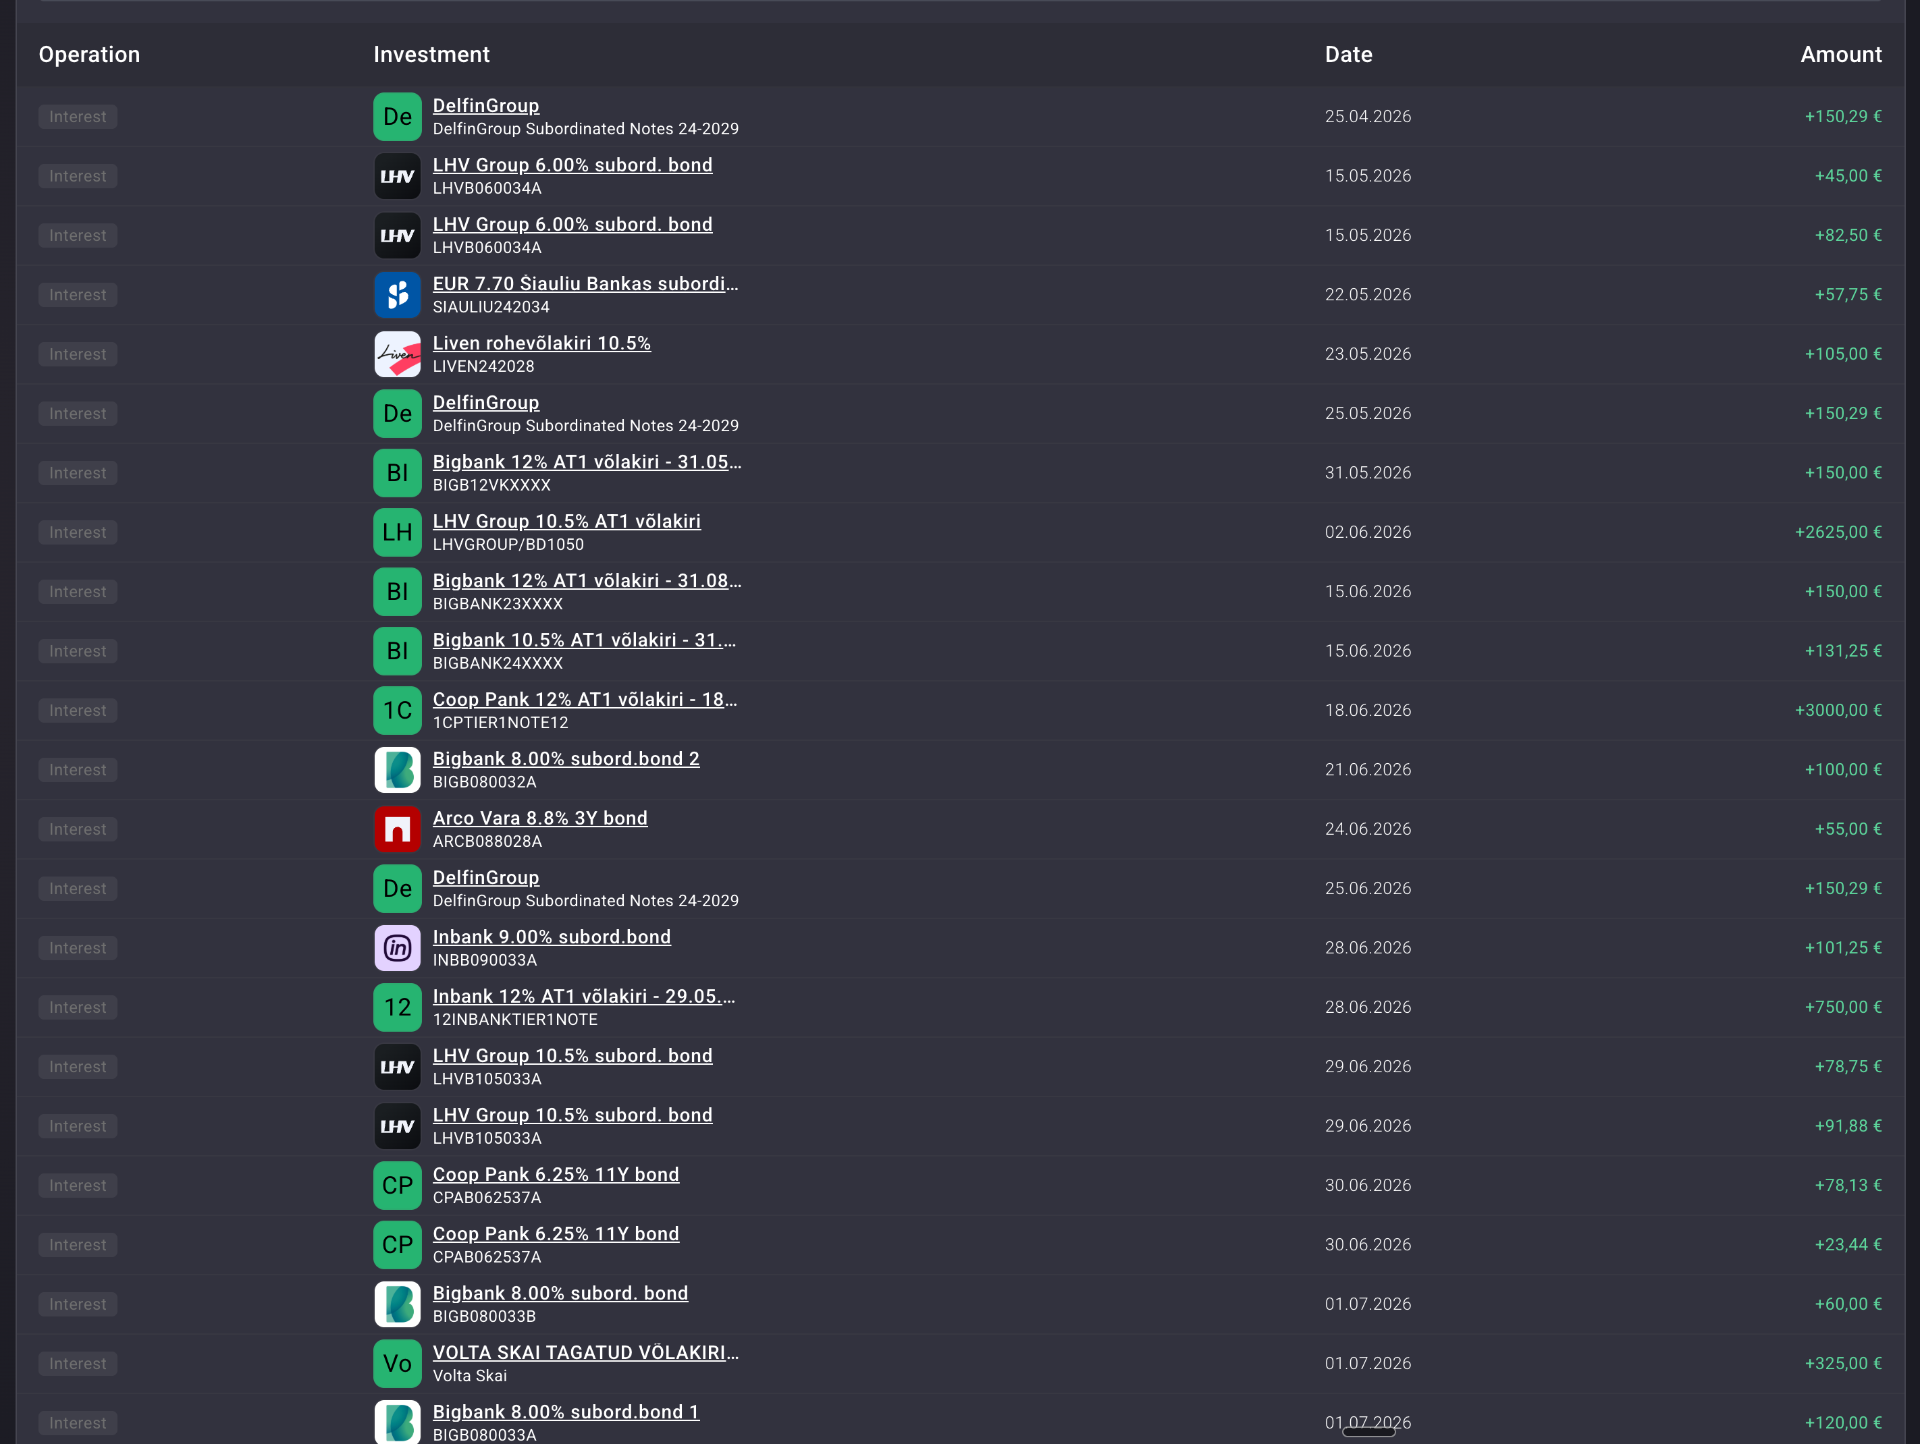
Every projected payment listed individually — operation type, instrument with logo and ticker, the exact date, and the amount. A bond paying quarterly coupons appears as four rows per year. A property generating monthly rent appears as twelve. Nothing is aggregated away. The next six months become something you can read top to bottom.
Which months spike. Which are flat. And why.
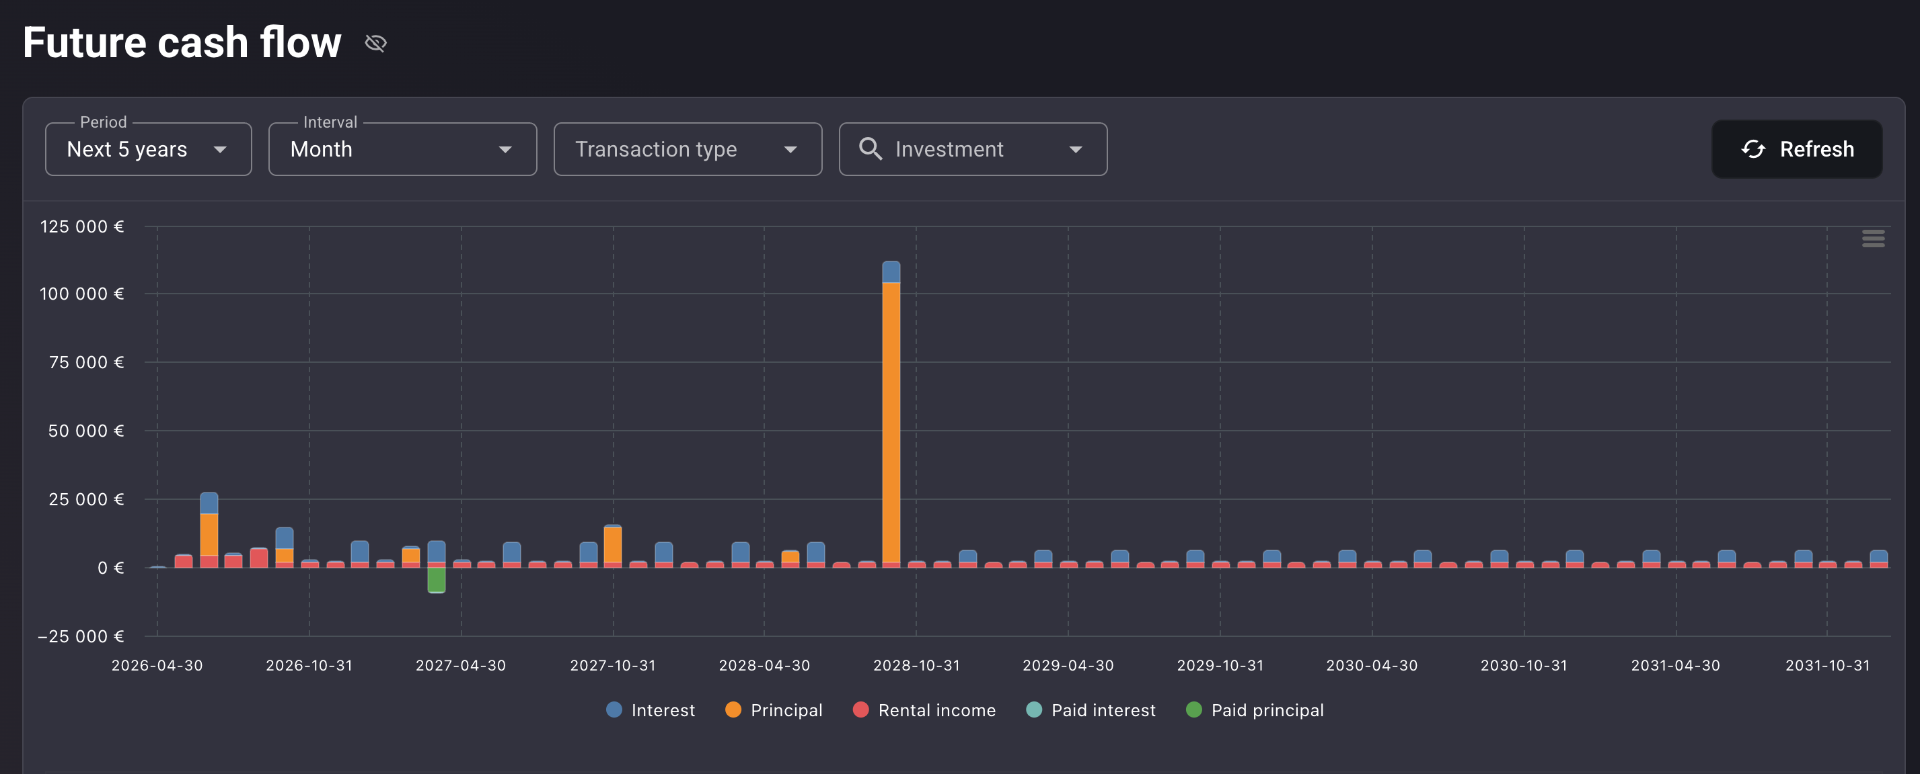
Five colour-coded categories — Interest in blue, Principal in orange, Rental income in pink, Paid interest in teal, Paid principal in green — stacked monthly across the full horizon. Multi-year patterns become visible at a glance: bond maturities clustering in one quarter, rental income thinning out after a lease ends, a single large principal repayment standing nearly four times the height of any other month.
The total trajectory, compounding left to right
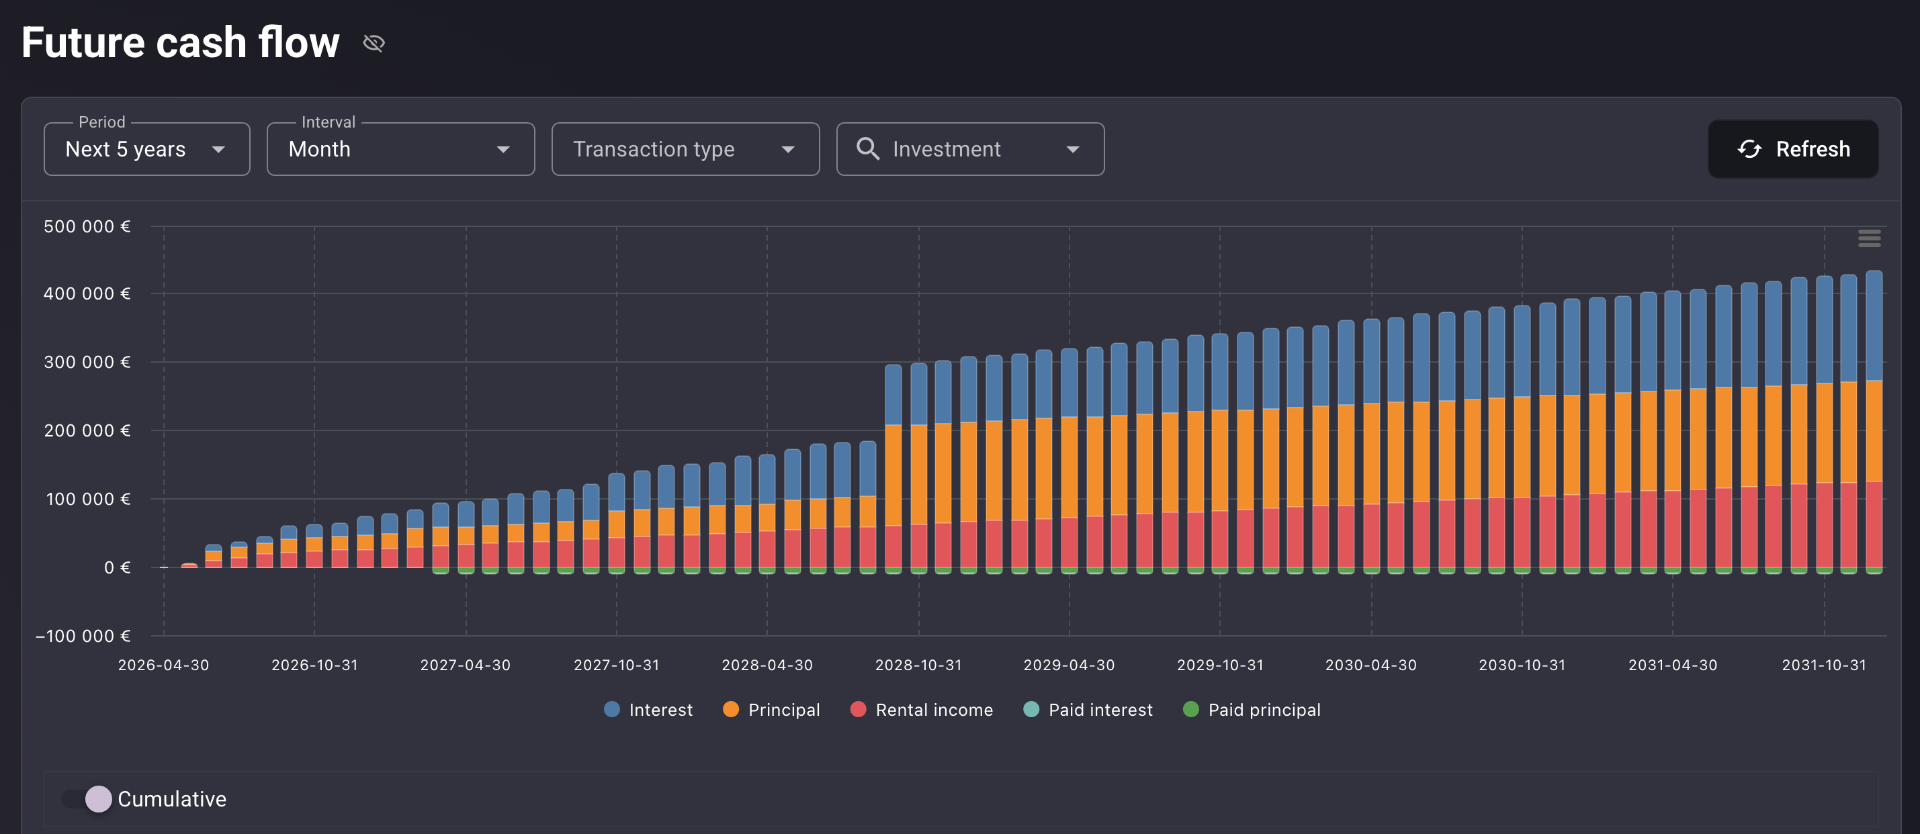
Toggle Cumulative and every category re-renders as a stacked, growing bar across the full horizon. The question changes from "what arrives this month?" to "what will I have received in total by the end of year three?" The relative contribution of each income category to the total trajectory becomes visible over time.
Filter to one stream. Read the headline totals.
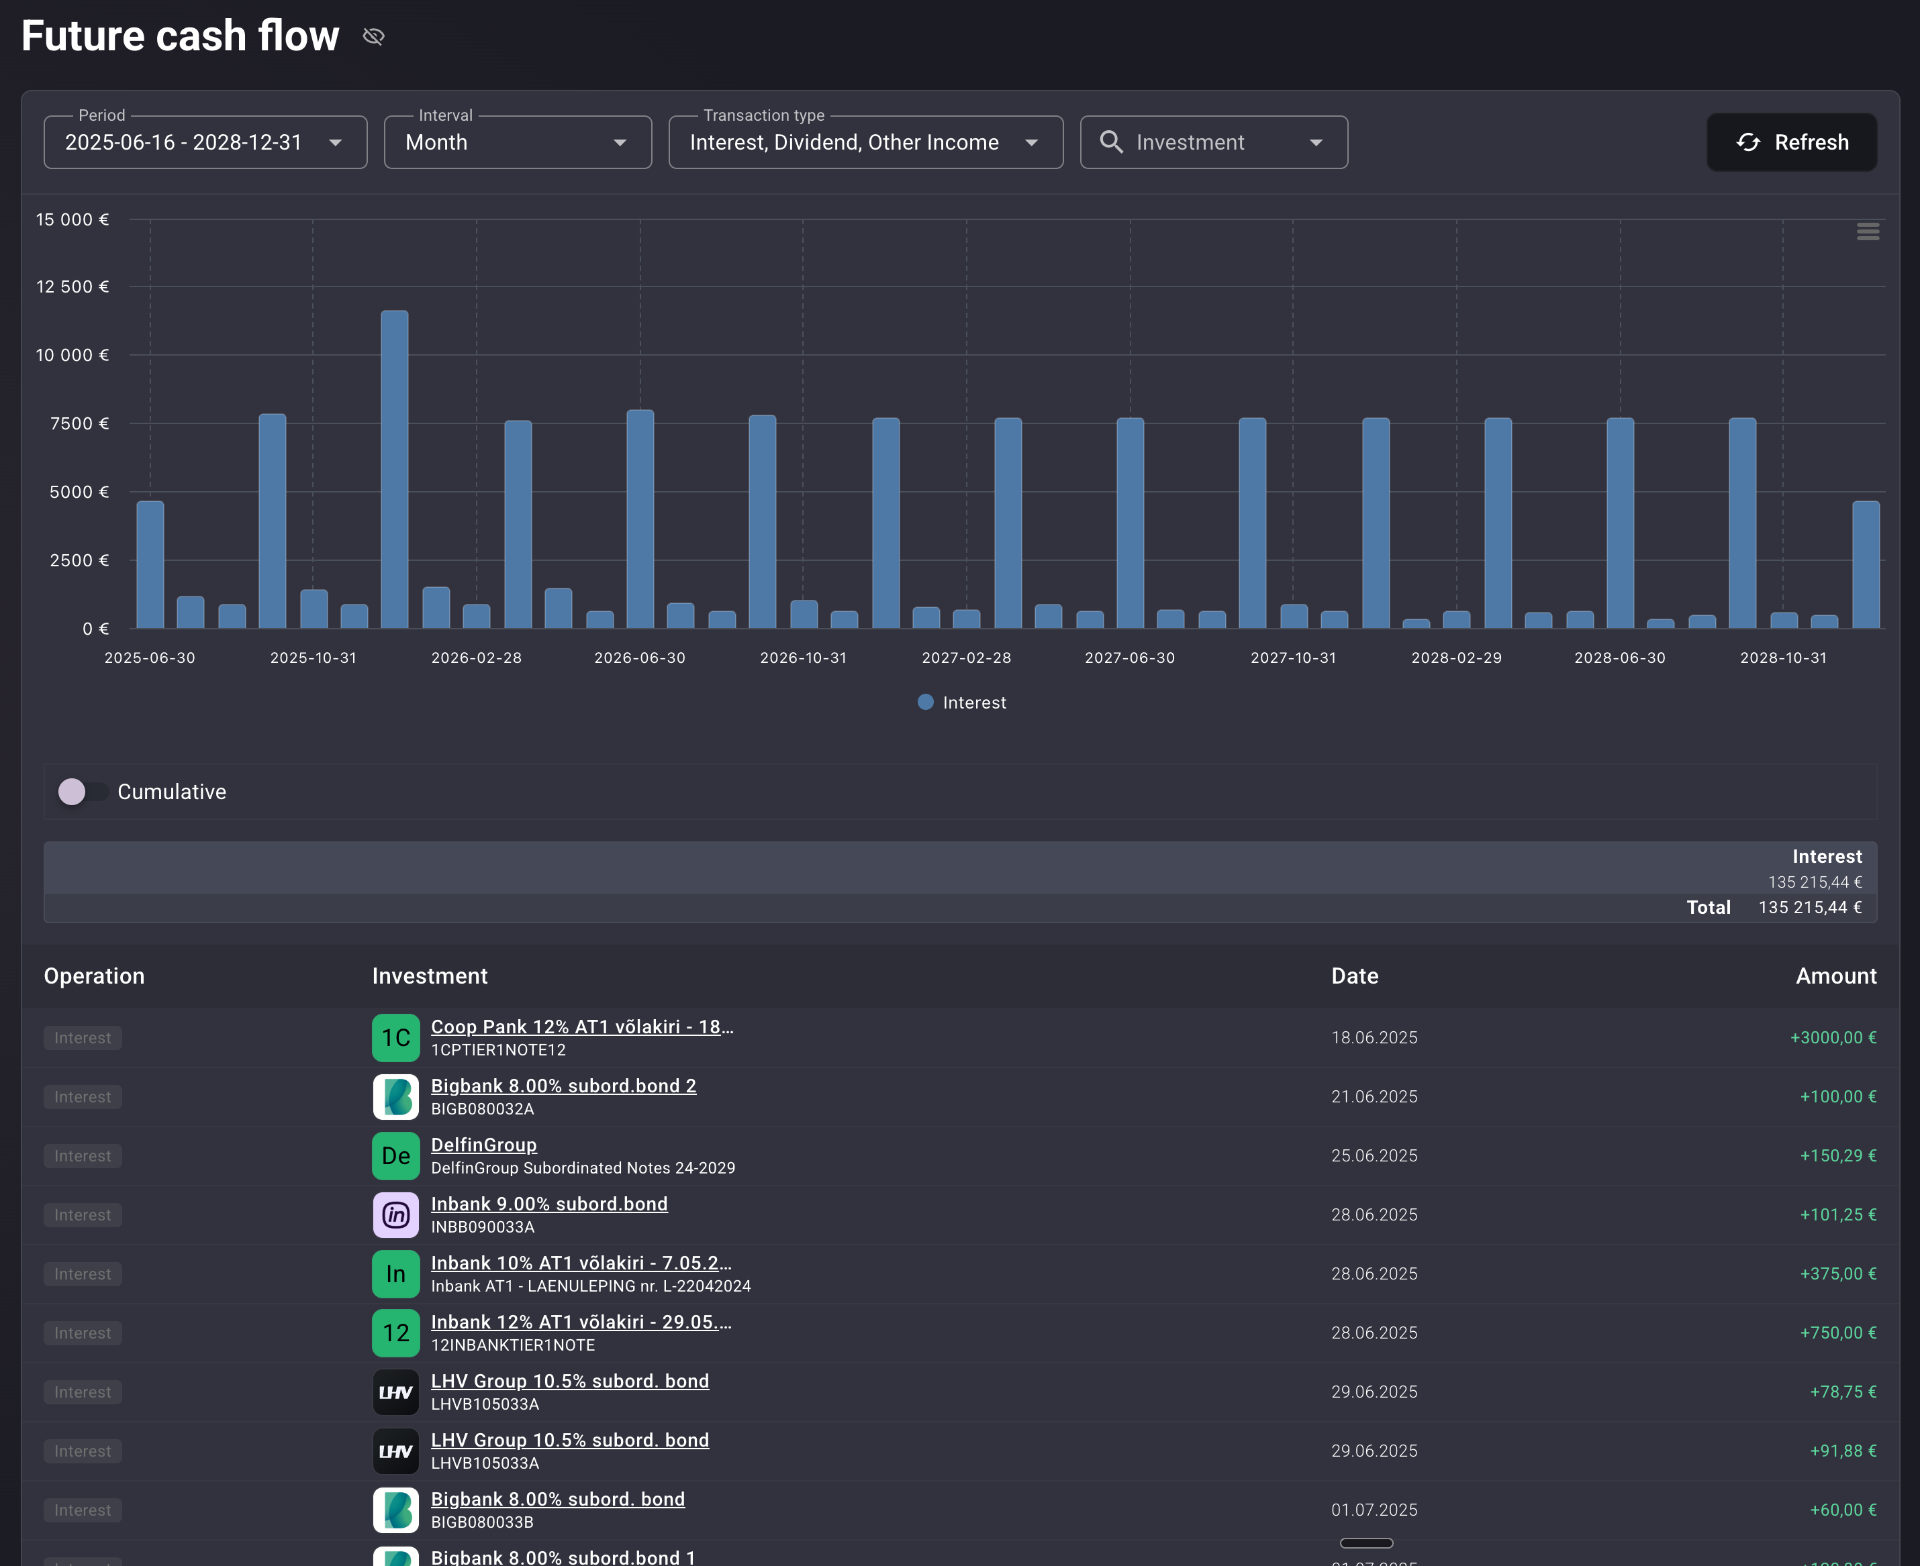
Transaction type and Investment filters isolate any single stream — just bond interest, just rental income, just one issuer's full payment schedule. The summary panel at the top of the report surfaces headline totals across the selected horizon — total projected interest, principal, rental income, and outstanding liability obligations. The aggregate picture without scrolling.
Built to map every contractual cash event
Up to five-year horizon
Selectable Period — next year, next three, next five. Monthly interval out of the box; switch as the planning question changes.
Five colour-coded categories
Interest, Principal, Rental income, Paid interest, Paid principal. Income and outgoings on the same axis — net cash position visible immediately.
Periodical bar chart
Month-by-month stacks across the full horizon. Spikes and troughs — bond maturity clusters, lease gaps — readable at a glance.
Cumulative chart view
Toggle to a stacked, growing trajectory. Total projected income across the full period, by category, in one curve.
Itemised cash flow table
Every projected event as its own row — instrument, date, operation type, exact amount. Sorted chronologically.
Transaction type & Investment filters
Isolate a single category or a single issuer. The summary panel updates with totals for whatever's in view.
Works across listed bonds, unlisted and subordinated bonds, loan contracts, real estate, and crowdfunding instruments. Liabilities are shown alongside assets — the rental income on a mortgaged property and the mortgage interest itself appear in the same view.
Every angle on your cash flow
The same projected events, rendered four different ways. The right view depends on what you're planning for.
Month-by-month stacked bars across all five categories. Income spikes — like a maturing bond\'s principal repayment — stand out instantly.
Real-life use cases
The €108,000 spike, eight months out
Eleven bonds across three platforms. The Future Cash Flow report shows October 2028 as a single bar nearly four times the height of any other month — a maturing bond's principal repayment. Eight months' notice to plan exactly where to redeploy it.
The €45,000 of interest you couldn't add up
Planning the 2027 budget. Switch to Cumulative and read off total projected interest across all bonds — approximately €45,000 by the end of that year. A figure that was previously buried across four separate broker statements.
Rental income, next to mortgage interest
A property investor with a mortgage. Pink rental bars and teal paid-interest bars in the same monthly chart — netted visually for the first time. Net cash generation turns out to be lower than the gross yield number suggested.
Fits the way income investors actually invest
Income-focused investors
Living on or reinvesting regular coupon and rental payments. The calendar tells you what to expect, month by month, before it arrives.
Bond ladder strategies
Staggered maturities tracked as a sequence of reinvestment events — not a static yield figure. Every rung visible in time.
Leveraged real estate
Liability costs netted against rental income on the same chart. Net cash generation, not gross yield, becomes the figure you plan around.
Multi-platform portfolios
Income events scattered across brokers, finally as a single calendar. One unified schedule for everything you hold.
One unified income calendar, across every instrument you hold
Most broker and custody platforms show you what you hold. A few will show the next coupon date for a single instrument. None will show you a unified, multi-instrument, colour-coded calendar of every cash event across bonds, real estate, and loan instruments — alongside the liability outflows that offset them — for the next five years.
Portfellow does, automatically, from the instruments already in your portfolio. No spreadsheet maintenance. No manual date-tracking. No logging into four platforms to reconstruct your own income schedule.
Suggested workflow
Ten steps from "money is coming in somewhere" to "I know exactly when, from where, and how much."
Add every income-generating holding
Bonds, real estate, loan instruments, crowdfunding contracts — and any liabilities that sit alongside them.
Open the report
Future Cash Flow loads and projects every contractually scheduled event automatically.
Set the Period
Choose your planning horizon — next year, next three years, next five.
Read the periodical chart
Look across the months. Note the spikes — large principal repayments stand out immediately.
Toggle Cumulative
Read the total projected income trajectory by category across the full horizon.
Check the summary panel
Headline totals for interest, principal, rental income, and liabilities — without scrolling.
Filter by Transaction type
Isolate a single category — e.g. Principal only — to see exactly when repayments cluster.
Filter by Investment
Pick a single issuer or property. Read its full payment schedule end to end.
Scroll the itemised table
Confirm exact dates and amounts for the next three to six months.
Plan around the calendar
Reinvestment timing, liquidity buffers, spending decisions — all anchored to the actual schedule.