Twelve months of investing deserves more than a closing balance and a percentage
Year in Numbers is Portfellow's cinematic annual review — a full-screen, scroll-through experience that pulls your portfolio's year into one place. Performance, benchmarks, passive income, best and worst picks, and a summary card worth sharing.
For investors who want a year-end moment, not a year-end statement
If you've worked on your portfolio all year, the moment of seeing the full picture should feel like an event.
Investors who track all year
You watch the dashboard, read the reports, and adjust as you go. You want a single annual reckoning that brings the whole year together.
Anyone wanting the full picture in one view
Best month, best pick, total passive income, peer ranking, benchmark comparison — without opening five tabs and piecing it together yourself.
Investors who share milestones
With a partner, an investing group, or on social media. A format worth sharing — not a screenshot of a chart taken out of context.
"What kind of year did I actually have?"
You\'ve asked the question. The honest answer requires performance, benchmarks, income, and behaviour in one place — and a baseline for the year ahead.
Year-end portfolio reviews barely exist
Most brokers give you a balance and a percentage. Sometimes a PDF of transactions. The full story of your investing year lives nowhere.
A balance is not a year
A closing number tells you where you ended — not what happened along the way. No best month. No worst month. No income breakdown. No benchmark.
No view stitches the picture together
Performance lives in one report. Income lives in another. Trades live in a third. There is no single scroll that puts them in the same narrative.
No peer ranking, no honest context
A 7% return — is that good? Without seeing where you sit relative to other investors and the major indices, the number is floating in space.
Nothing worth sharing
You can't post a screenshot of five different reports to your investing group. Without a designed summary, the year stays in the app and never gets a moment.
Most investors end the year without any of this — and start the next one without a clear baseline.
How the Year in Numbers solves this
A full-screen, card-by-card narrative — your portfolio's year, told the way it deserves to be told. The format is cinematic. The numbers are exact.
Start of year, end of year, and everything that happened in between
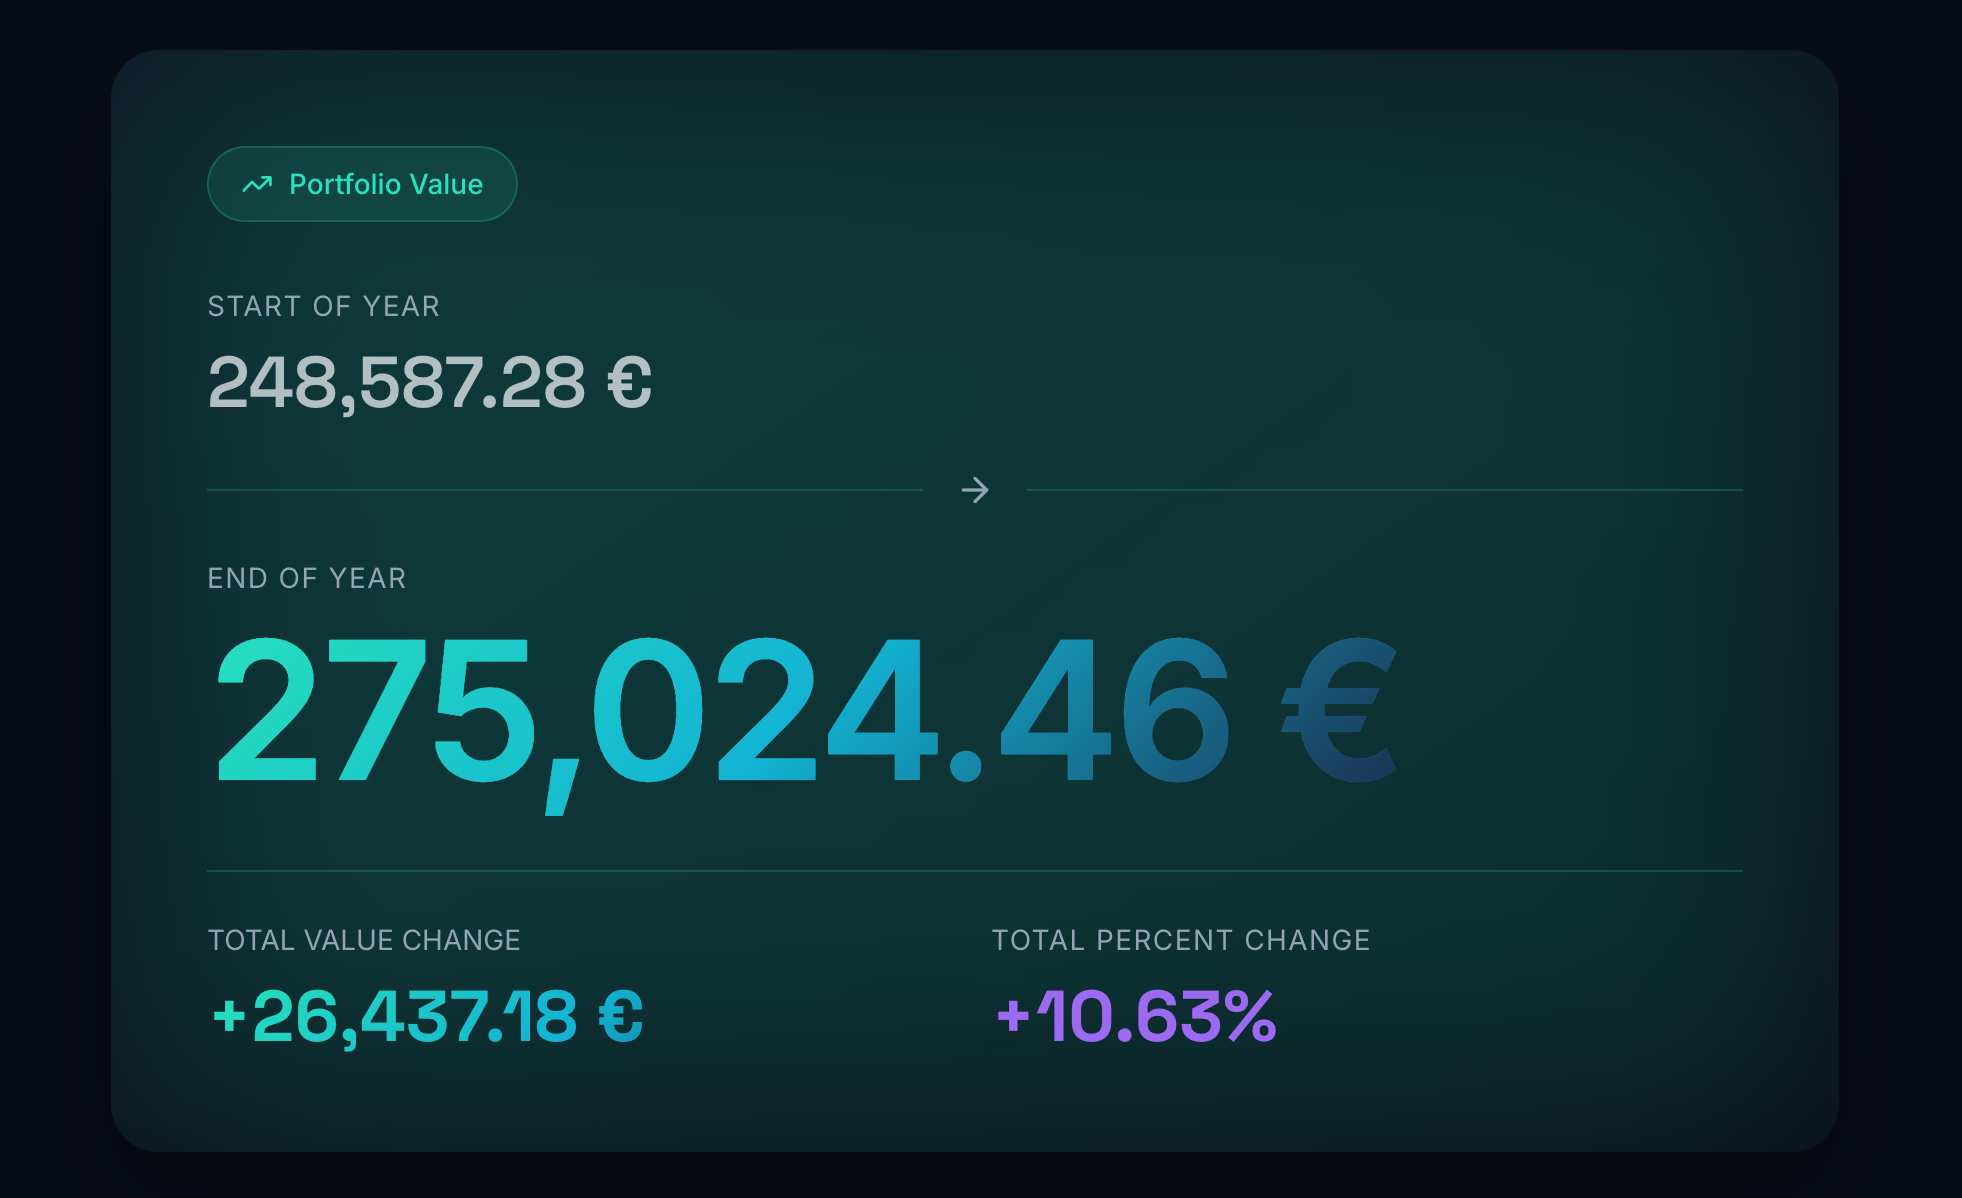
The opening data card sets the simplest version of the story: where you began, where you ended, and the absolute and percentage change. From there, the experience scrolls through performance, benchmarks, income, allocation, activity, and your top picks — one large, declarative card at a time. Dark backgrounds, display typography, gradient colours. It feels like a moment, not a report.
Your money-weighted return, with context
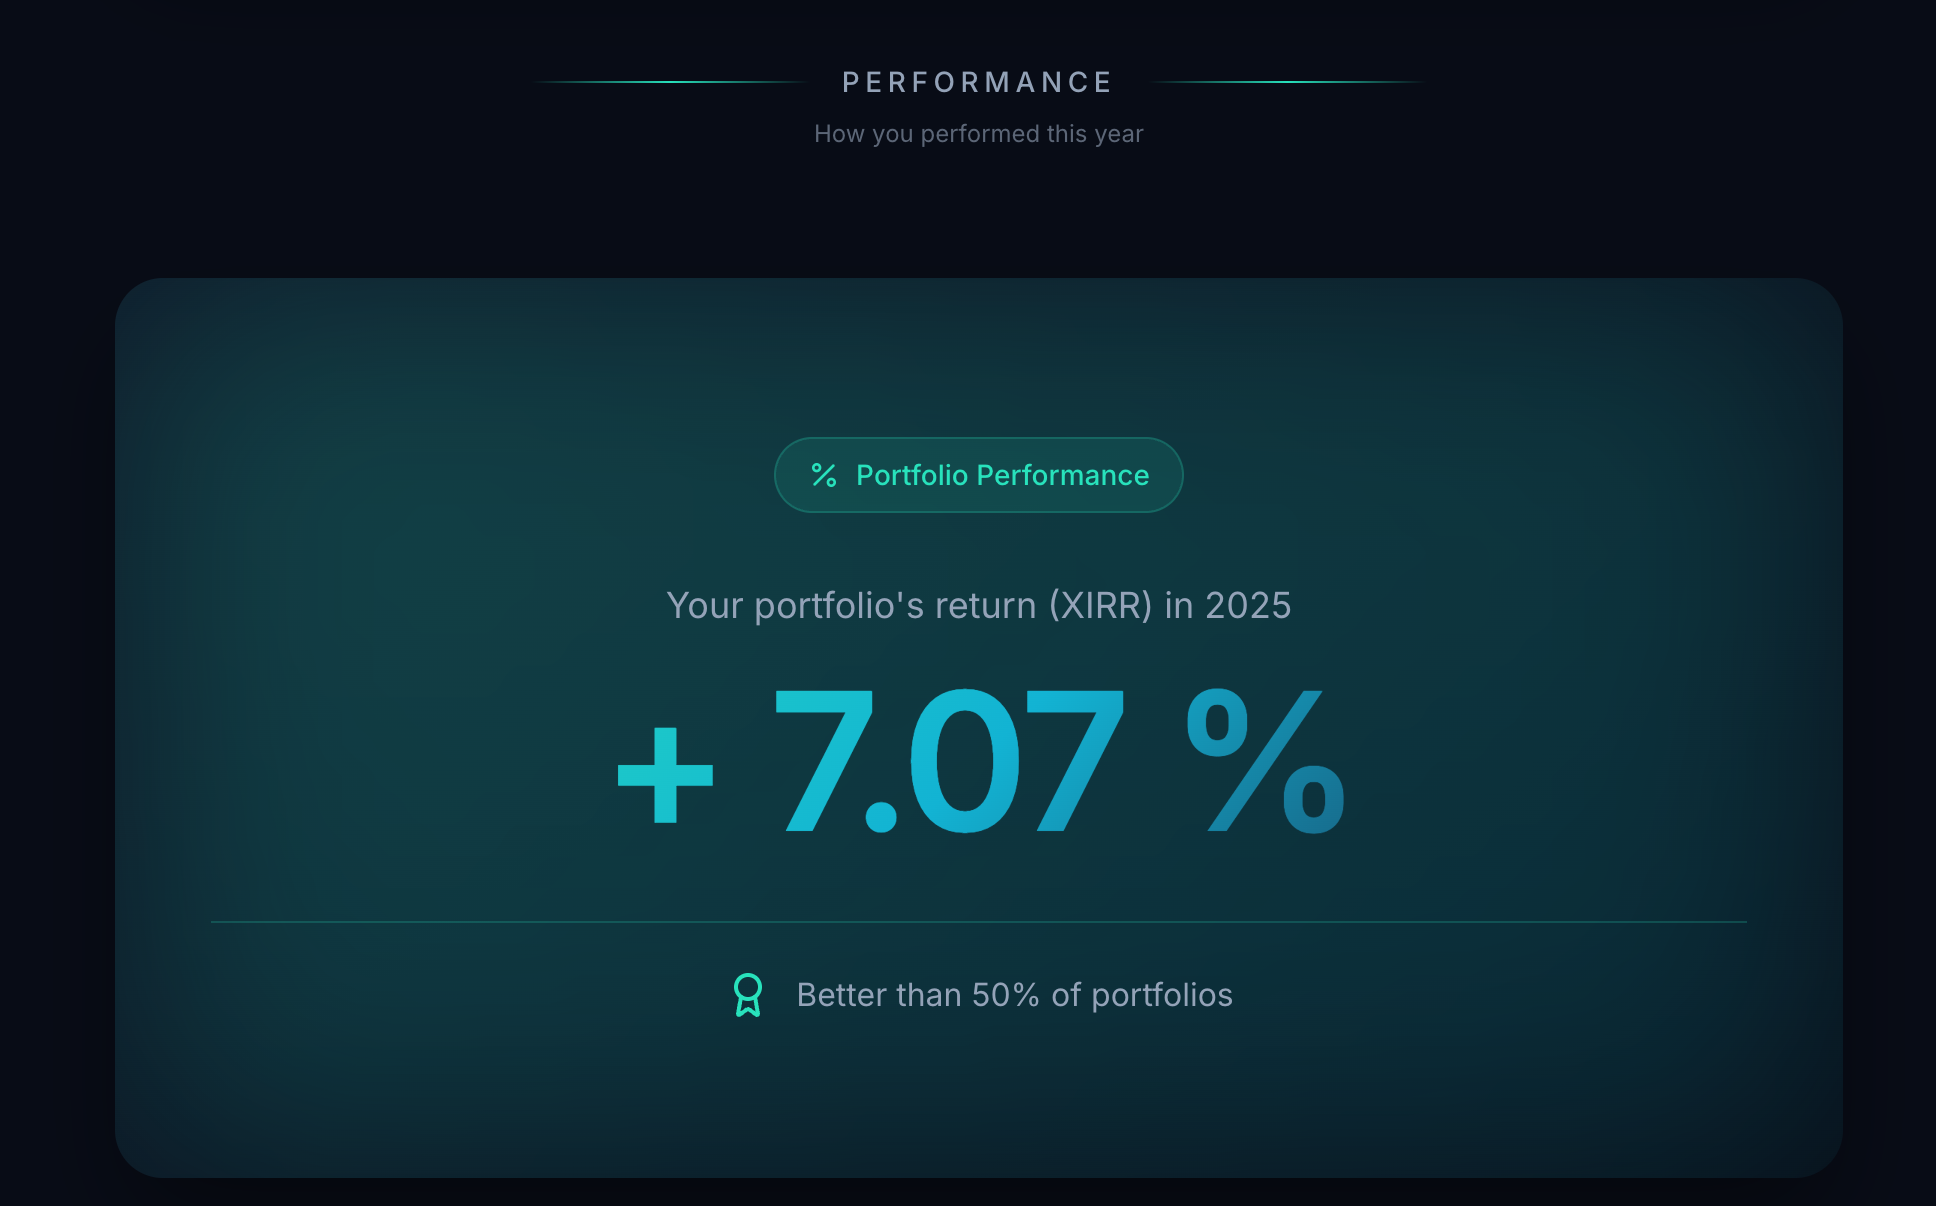
A dedicated card shows your portfolio's XIRR for the year as a single large figure — and immediately places it against other Portfellow users. "Better than 50% of portfolios" is not an abstract benchmark; it is your number, in the company of real investors with real portfolios. Peer ranking is what turns a percentage into an answer.
You vs. last year. You vs. the indices.
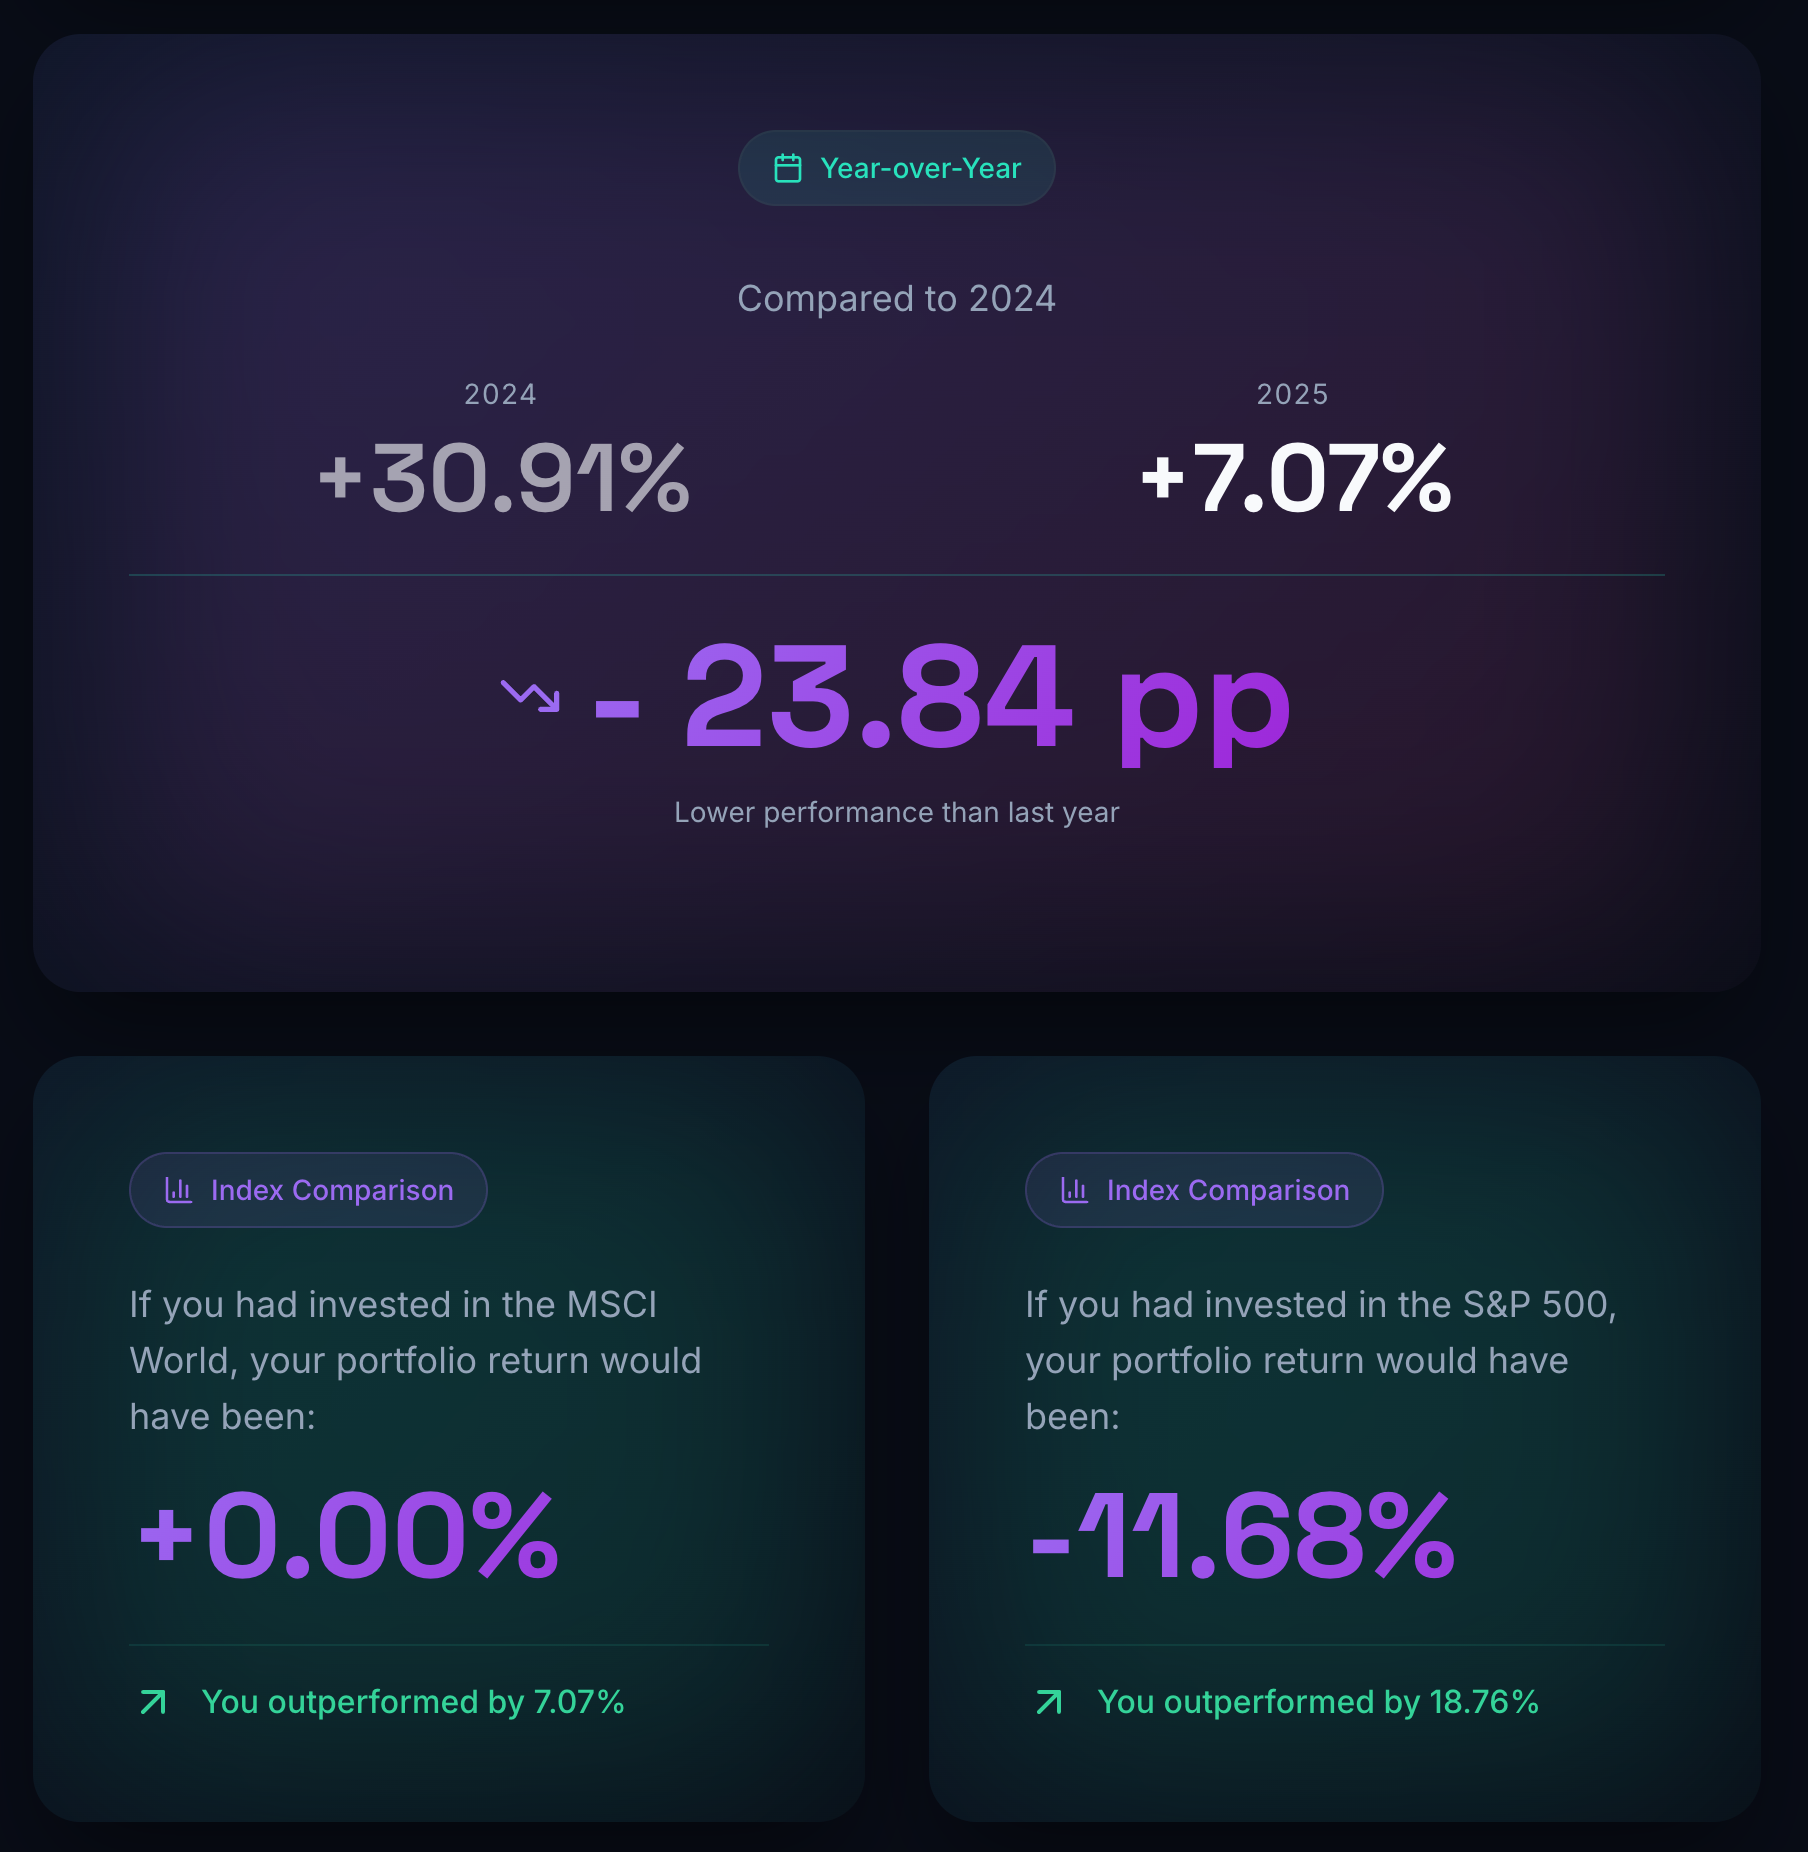
A side-by-side year-over-year card shows last year's return next to this year's, with the difference in percentage points. Two further cards show what you would have returned if you had instead held the MSCI World or the S&P 500 — with a personal "you outperformed by X%" indicator. The benchmark stops being theoretical the moment it is calculated against your actual portfolio.
Dividends, interest, and rent — separated, not summed
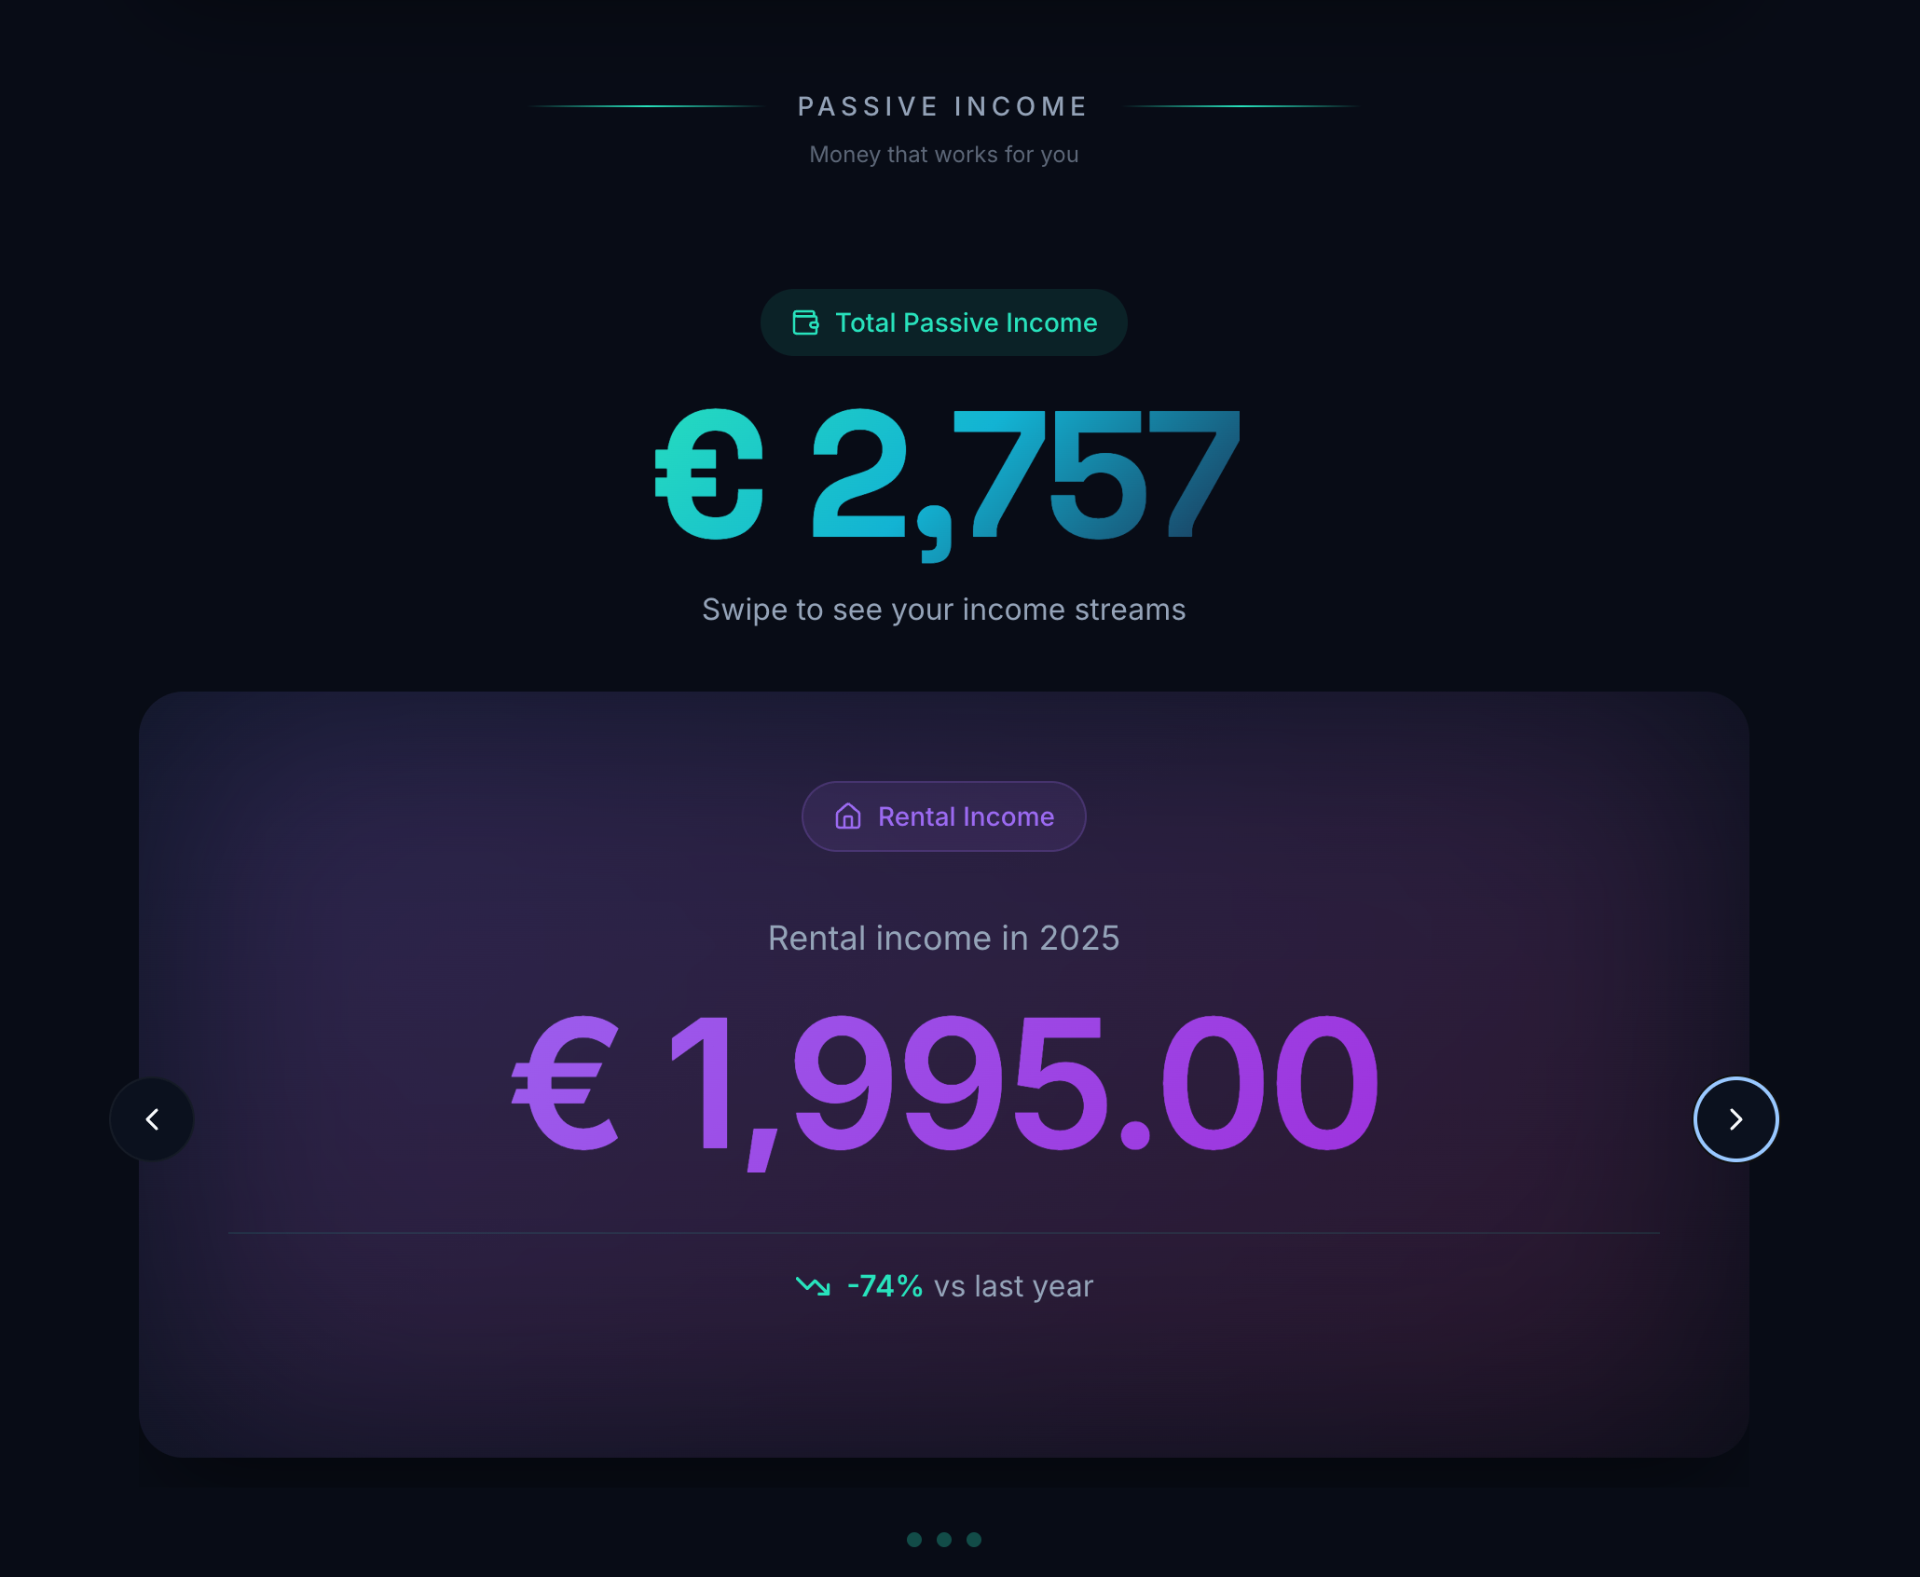
A headline Total Passive Income figure opens the section, followed by swipeable cards for each income stream. Dividend Income, Interest Income, and Rental Income each get their own card with the change versus last year shown explicitly. You see not just what your portfolio paid you, but where it came from — and how it moved.
Your single best pick, and your single worst, named
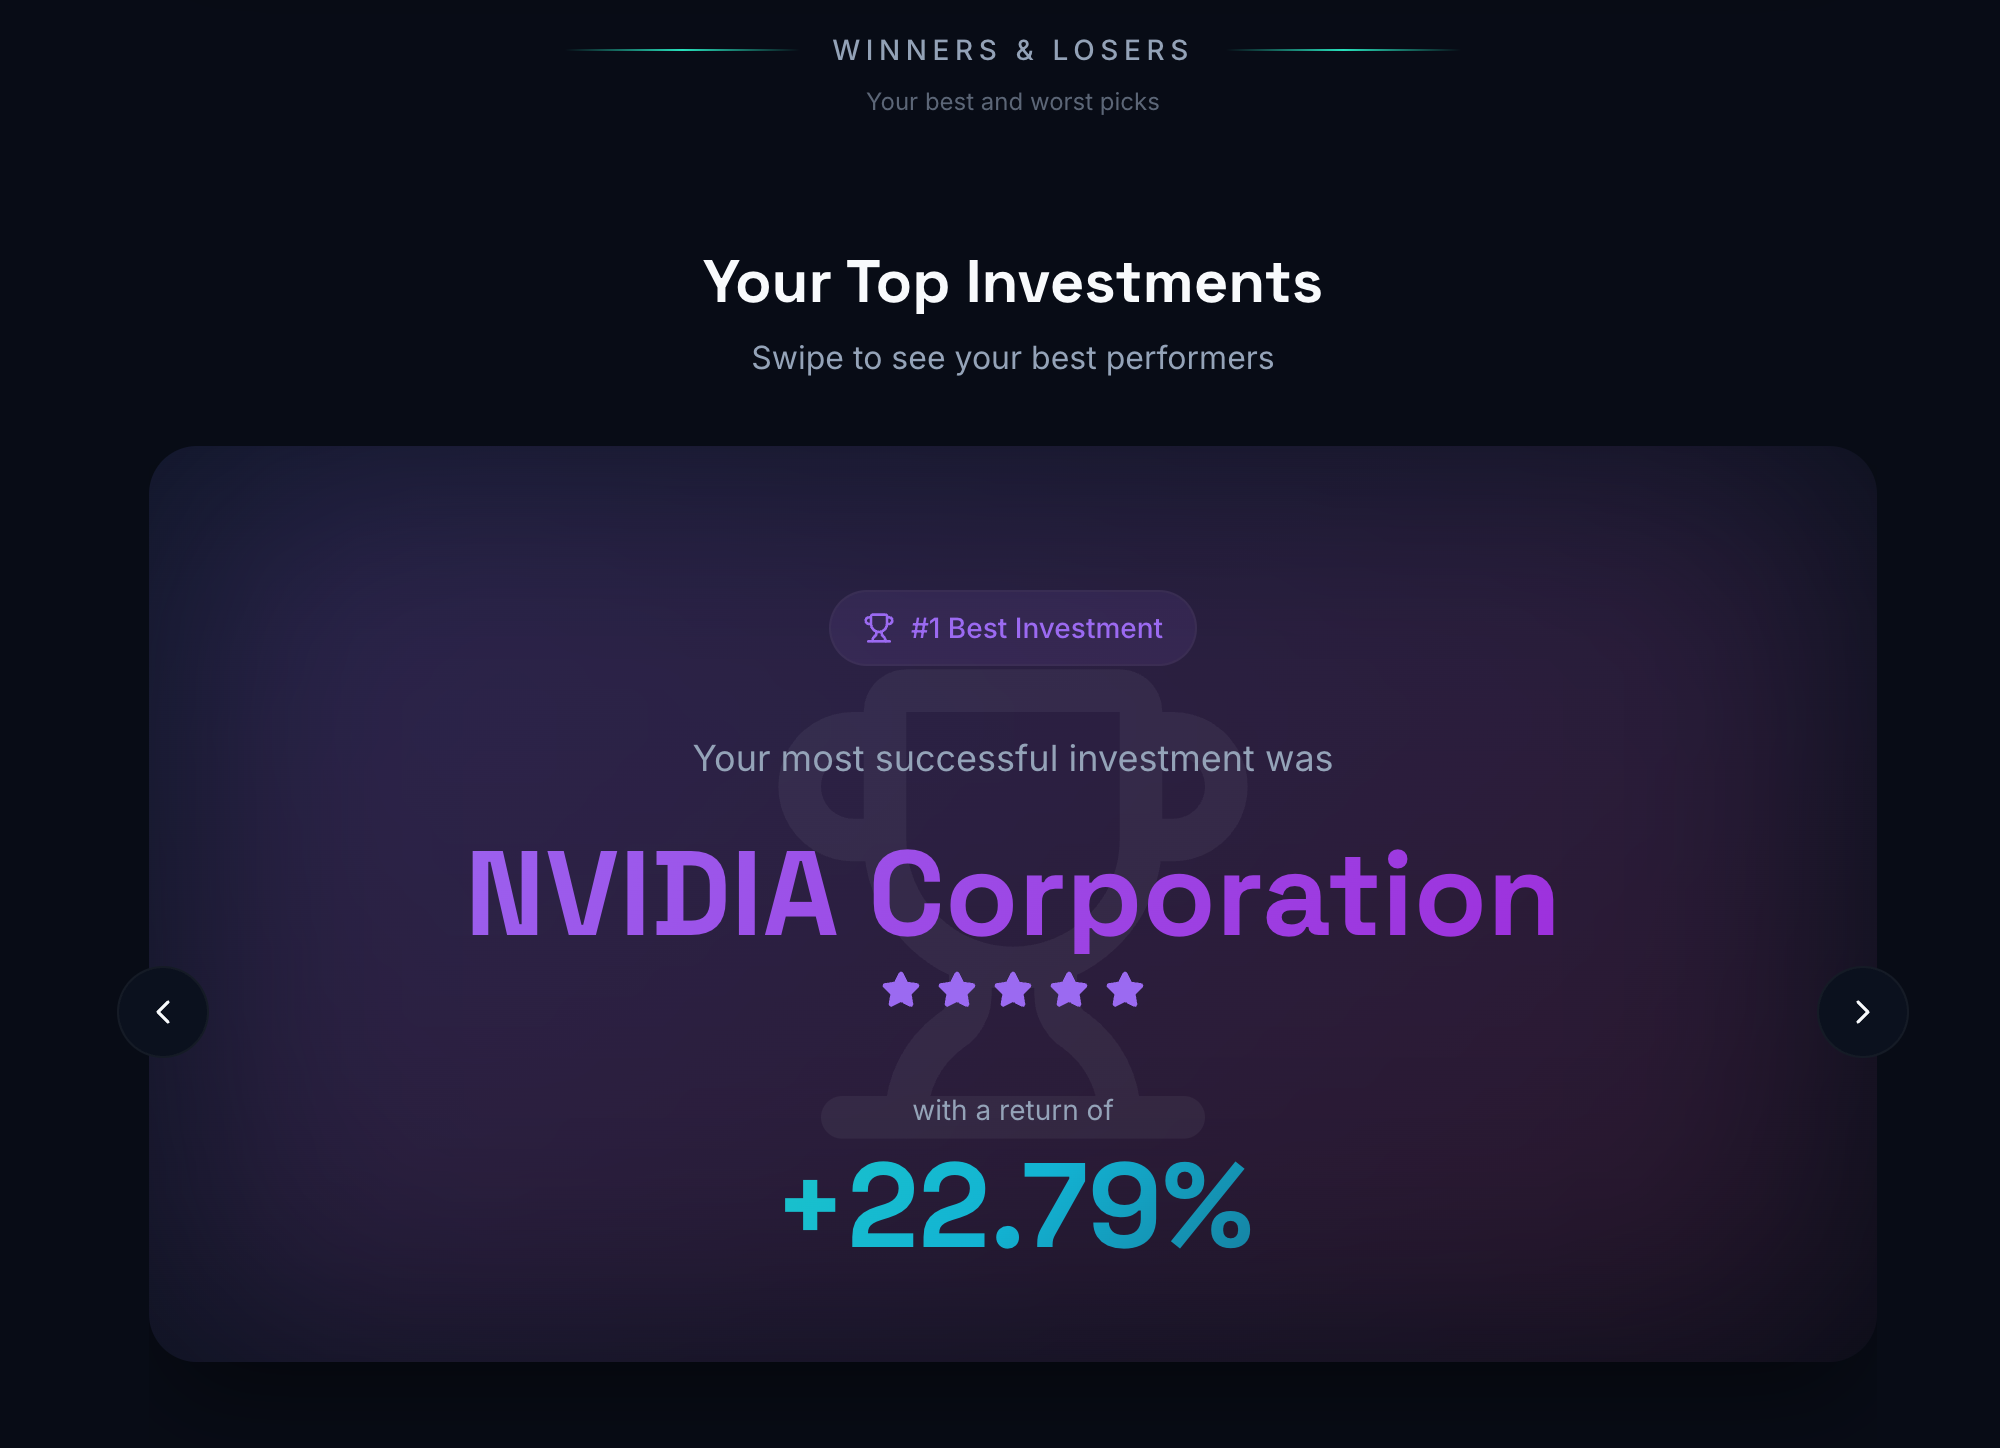
The Winners & Losers section reveals your #1 best investment and #1 worst investment of the year — the holding shown in large celebratory typography, with its return alongside. The best pick gets a trophy and a five-star rating. The presentation is deliberate: the moment should feel earned. Honest, but not flat.
Five more cards from the scroll
The Year in Numbers covers more than performance. Allocation, monthly highs and lows, trading rhythm, capital deployed, and a closing card built to share.
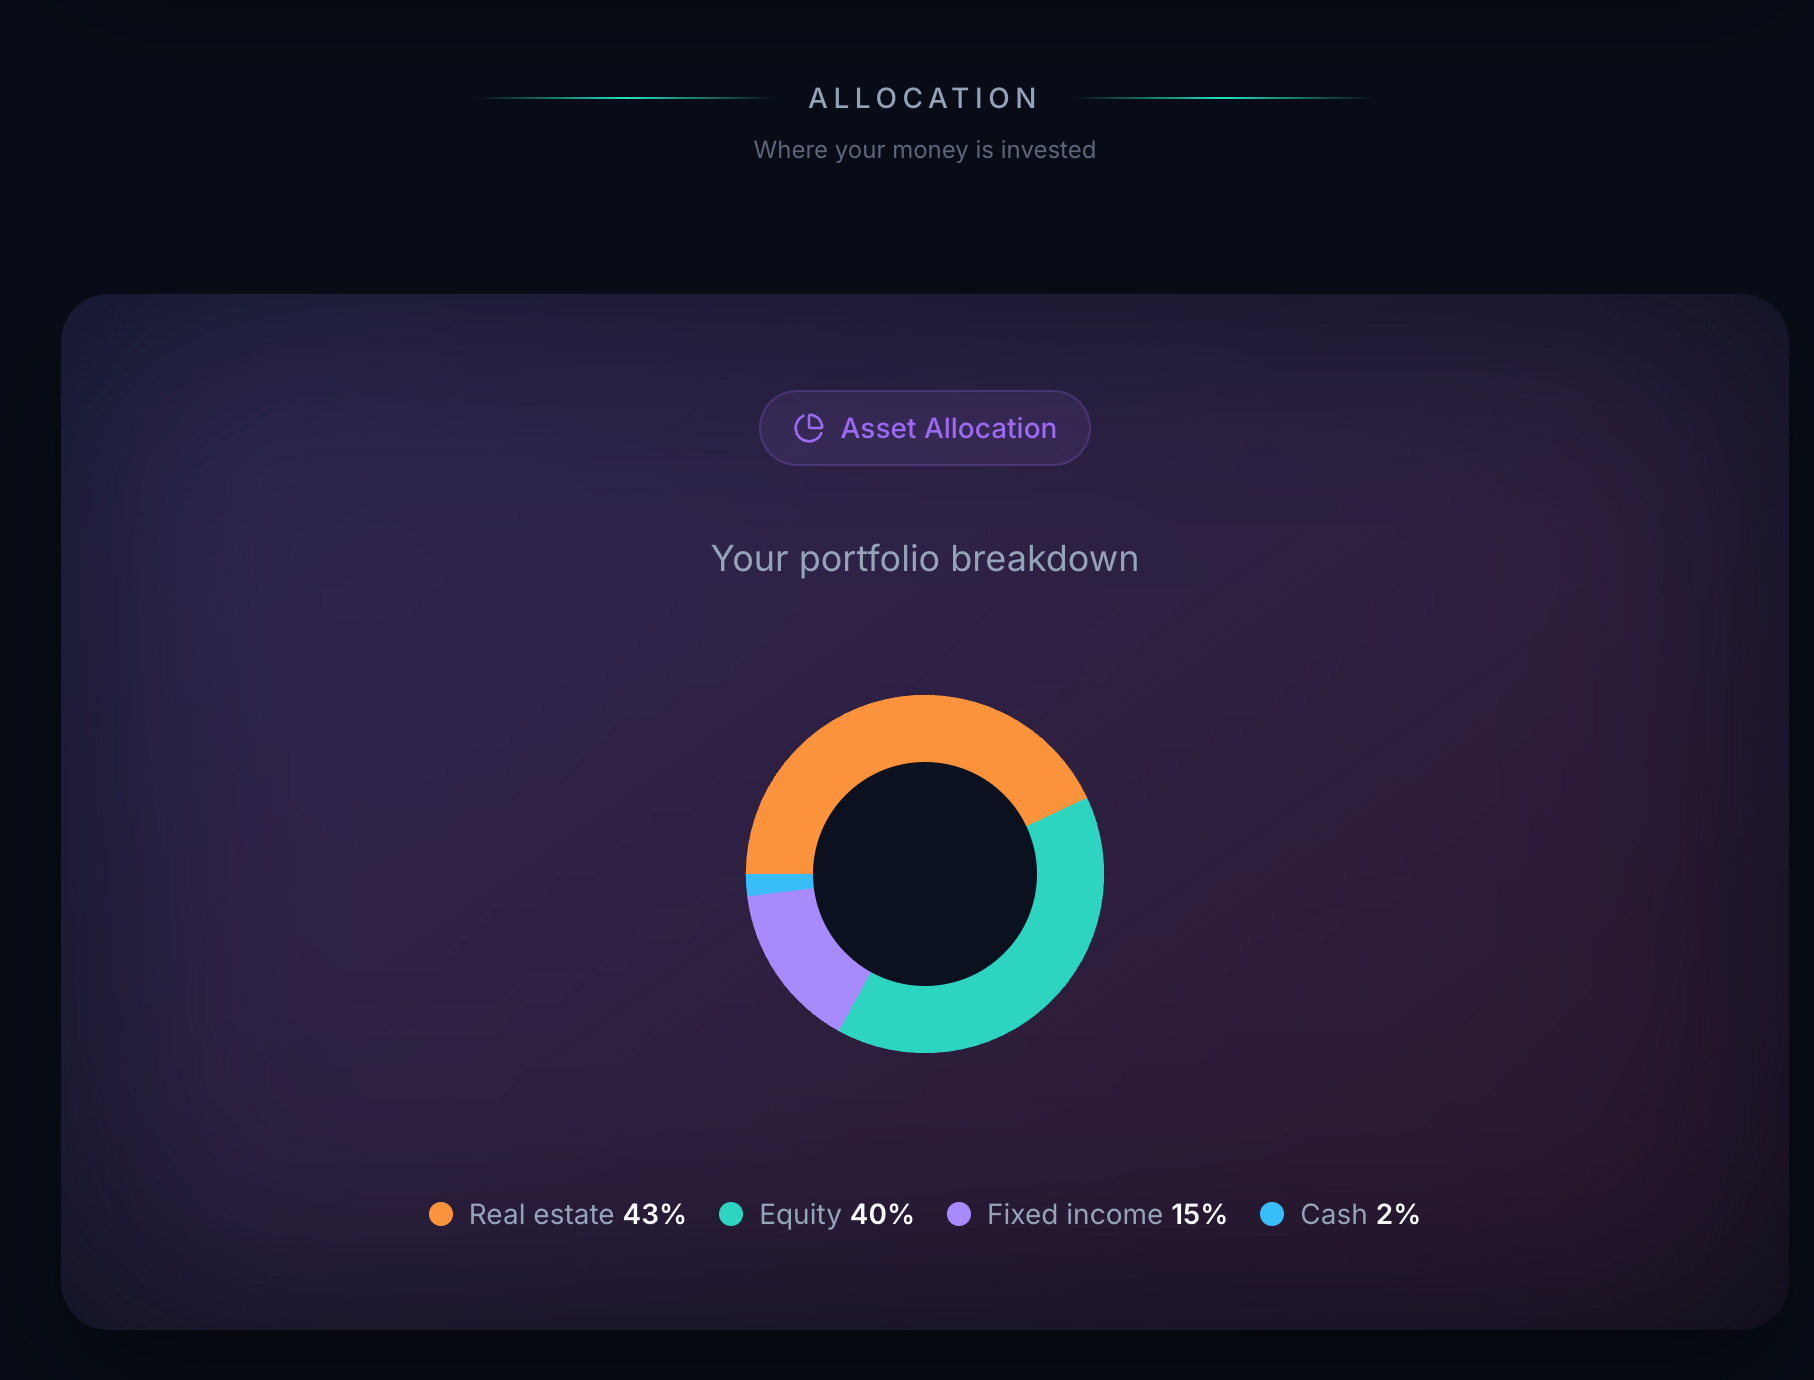
A full-screen donut chart shows where your money ended the year by asset class — Real estate, Equity, Fixed income, Cash. The shape of the portfolio at year-close, in one image.
Built to make the year visible
Cinematic full-screen scroll
Dark-mode design, large display typography, gradient colours. A scroll-through experience built to feel like an event.
Portfolio Value card
Start balance, end balance, absolute change, and percentage change — the simplest before-and-after for the year.
Four-stat summary ticker
Transactions made, new funds added, passive income, and XIRR performance. The year in four scannable numbers.
XIRR with peer comparison
Money-weighted return for the year, placed in context against other Portfellow users — "better than X% of portfolios".
Year-over-Year card
This year's return next to last year's, with the difference in percentage points displayed prominently.
MSCI World & S&P 500 comparison
What your portfolio would have returned in each index — with a personal outperformance indicator on each card.
Best and Worst Month
The month with the highest return in green, the lowest in red. The emotional shape of the year in two cards.
End-of-year allocation donut
Real estate, Equity, Fixed income, Cash — where your money ended, with percentage labels. Allocation at a glance.
Passive income breakdown
Total passive income headline, then swipeable cards for dividends, interest, and rental income — each with year-over-year change.
Activity & Most Traded
Total transactions, monthly average, and a ranked list of your most actively traded positions for the year.
Winners & Losers reveal
#1 best and #1 worst investments named in large display type, with returns alongside. Trophy and stars for the top pick.
Shareable closing card
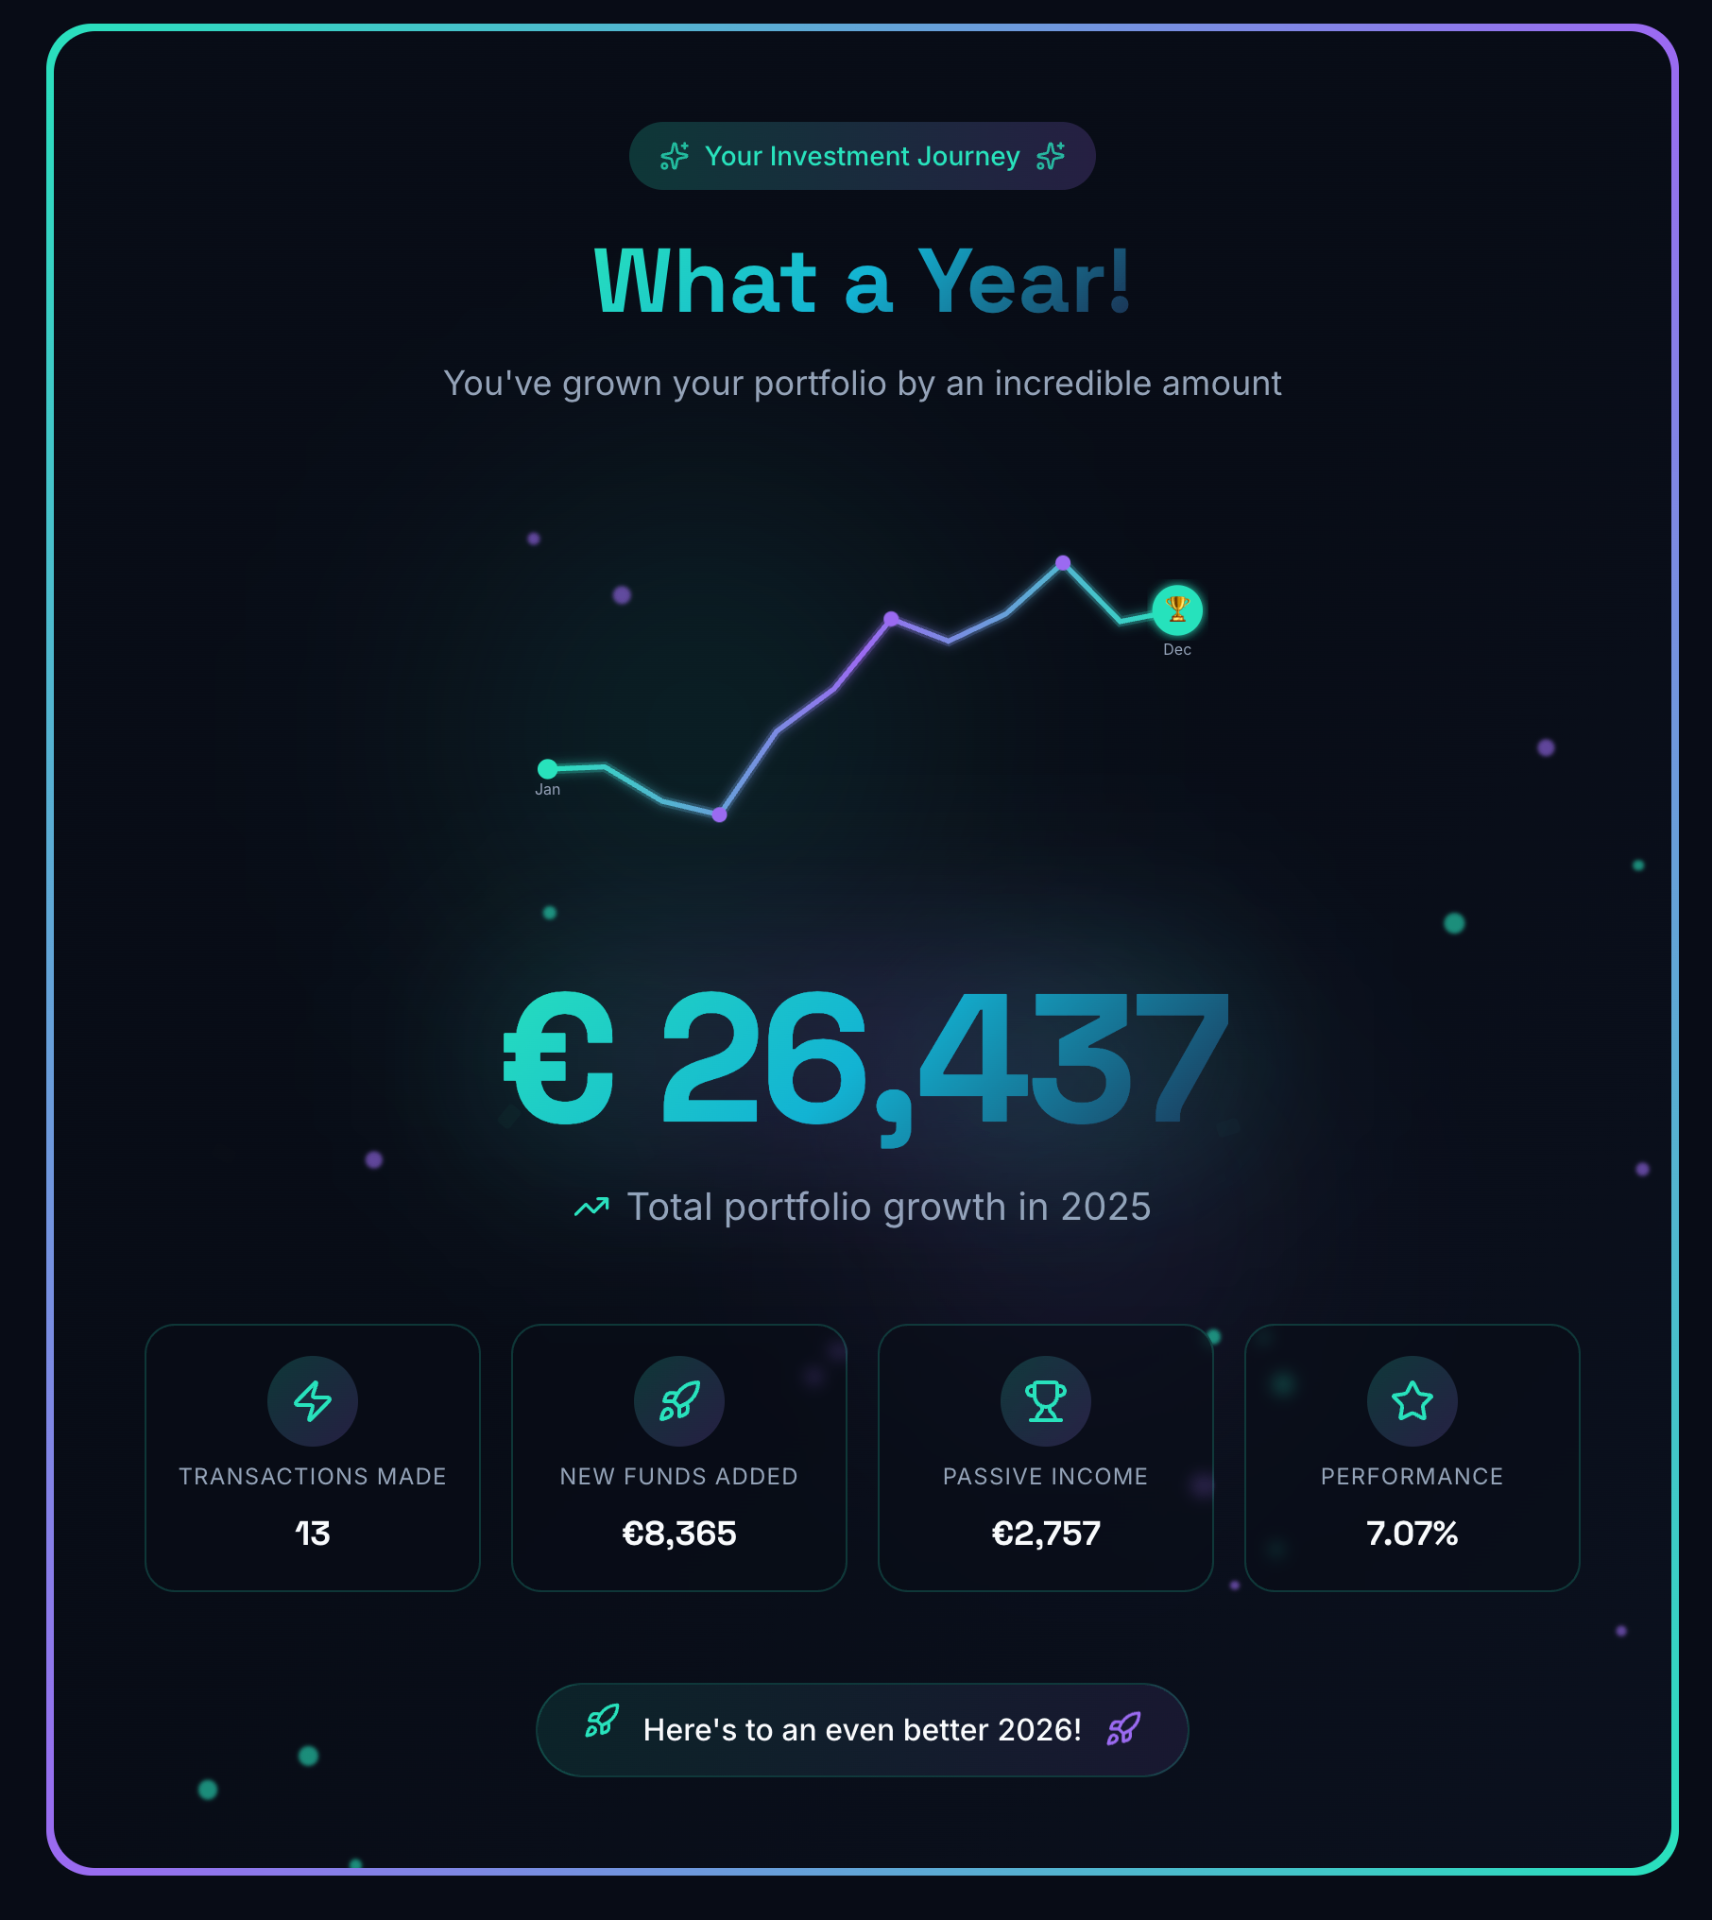
Full-year sparkline, four headline stats, and a forward-looking line — exportable as an image to share or save.
What it actually answers
Three moments from the scroll — each one a fact that lived nowhere else in a single view.
Three facts, one scroll
An investor opens the report in early January. XIRR was +7.07%. They outperformed the S&P 500 by 18.76% (which returned -11.68% that year). Their best month was May at +6.38%. None of those three facts had ever appeared in a single view before.
A lesson, side by side
The best investment of the year was NVIDIA at +22.79% — a holding the investor nearly sold in March (the worst month, at -6.10%). The Winners & Losers card and the Monthly Highlights card together turn that into a real lesson for the year ahead.
A summary worth sharing
An investor downloads the closing card — €26,437 portfolio growth, €2,757 passive income, +7.07% performance — and posts it to their investing group. The shareable format requires no explanation. The numbers tell the story.
Built for any portfolio worth reviewing
If your year had real activity in it, the Year in Numbers will find a story to tell.
Buy-and-hold investors
Measure your annual XIRR against the MSCI World and S&P 500. The honest comparison takes one card, not a spreadsheet.
Income-focused investors
See total passive income across dividends, interest, and rent in one figure — with each stream broken out and compared to last year.
Active investors
Trading Activity counts your trades; Most Traded ranks your most active positions; Winners & Losers names your best and worst picks.
Reflective investors
Anyone who values year-end reflection and goal-setting. The cinematic format gives the process a moment it doesn't get anywhere else.
A personal film of your investing year
No broker produces a Year in Numbers. They produce a year-end statement: a PDF of transactions and a closing balance. Portfellow produces something closer to a film.
The Year in Numbers is built from the same data that powers every other Portfellow report. XIRR, real cash flows, every asset class — calculated on exactly the same rigorous basis as the analytical reports. The format is cinematic. The numbers are exact.
Suggested workflow
The way to scroll through your year — once everything is in.
Record every transaction, dividend, interest payment, and rental event for the year in Portfellow.
Open the Year in Numbers report at year-end — December or January.
Let the opening title card load and scroll at your own pace.
Read the Portfolio Value card for the simple before-and-after.
Check the Performance card for your XIRR and where you sit relative to other investors.
View the Year-over-Year and Index Comparison cards against MSCI World and S&P 500.
Note your Best and Worst Month from the Monthly Highlights card.
Swipe through Passive Income — dividends, interest, rent — each with year-over-year change.
Review the Activity section: how often you traded and where you were most active.
Swipe through Winners & Losers to name your best and worst picks of the year.
Reach the closing summary card and download the shareable image.
Use the full picture to set priorities and goals for the year ahead.