For investors who hold more than one fund
If you own a handful of ETFs across themes or geographies, the headline number on each fund hides what's actually underneath.
Multi-ETF holders
Three to eight funds spanning global, US, ESG, EM, and Europe — and a quiet suspicion they overlap.
Hidden mega-cap concentration
You hold "different" funds. They all happen to be top-heavy in the same five US tech names.
ESG and thematic stackers
Four ESG funds sound diversified. Then you check, and they all hold Microsoft, Nvidia, and Apple.
Direct + funds mixers
You own NVIDIA directly and through three ETFs. You have no idea what your real NVIDIA position is.
The diversification you think you have
Owning more funds isn't the same as owning more companies. Most investors only find out the hard way.
Brokers show fund names, not holdings
Your broker tells you that you own VWCE, IWDA, and an ESG fund. It doesn\'t tell you they all sit on top of the same hundred companies.
60–70% overlap between "different" indices
A global ETF, a US ETF, and a tech ETF can share most of their top holdings. You think you're diversifying. You're actually concentrating.
No portfolio-level sector or country view
Each fund publishes its own sector breakdown. Adding them up across four funds, weighted by your position size, is a spreadsheet job nobody does.
"New" ETFs that just double down
You add a thematic ETF for diversification. Three of its top five holdings are already your three biggest positions. You bought more of what you already had.
How the Investment Exposure Report solves this
One report. Every fund opened up. Every overlap added together. Every exposure honestly named.
One company, one number
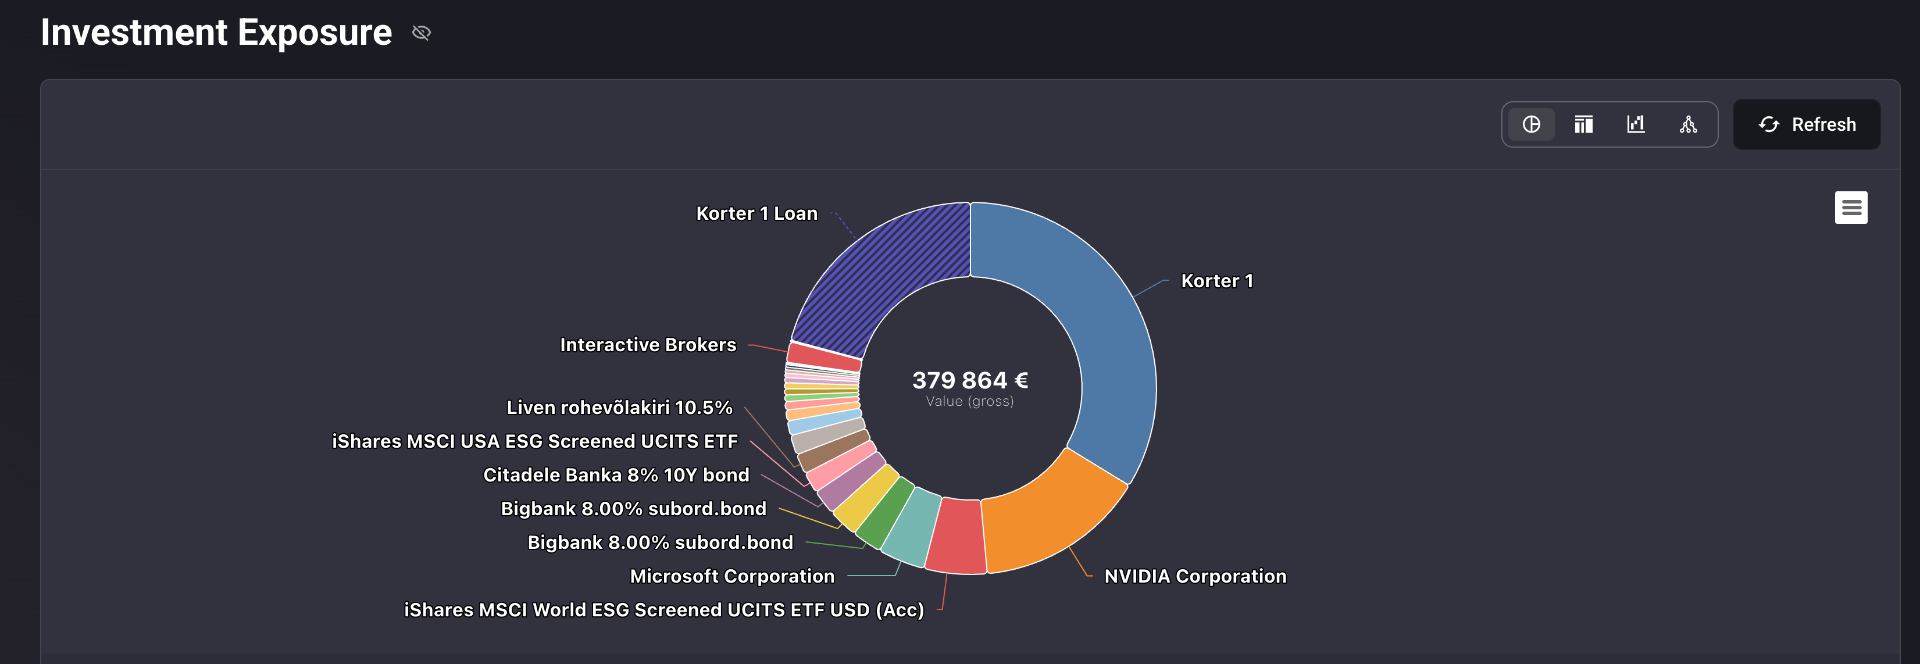
NVIDIA in three ETFs and held directly? That's one row, one weight, one value. Portfellow resolves every fund's underlying holdings and sums the overlap into a single ranked exposure. The number you see is the number you actually own.
Direct, Underlying, Residual, Grouped
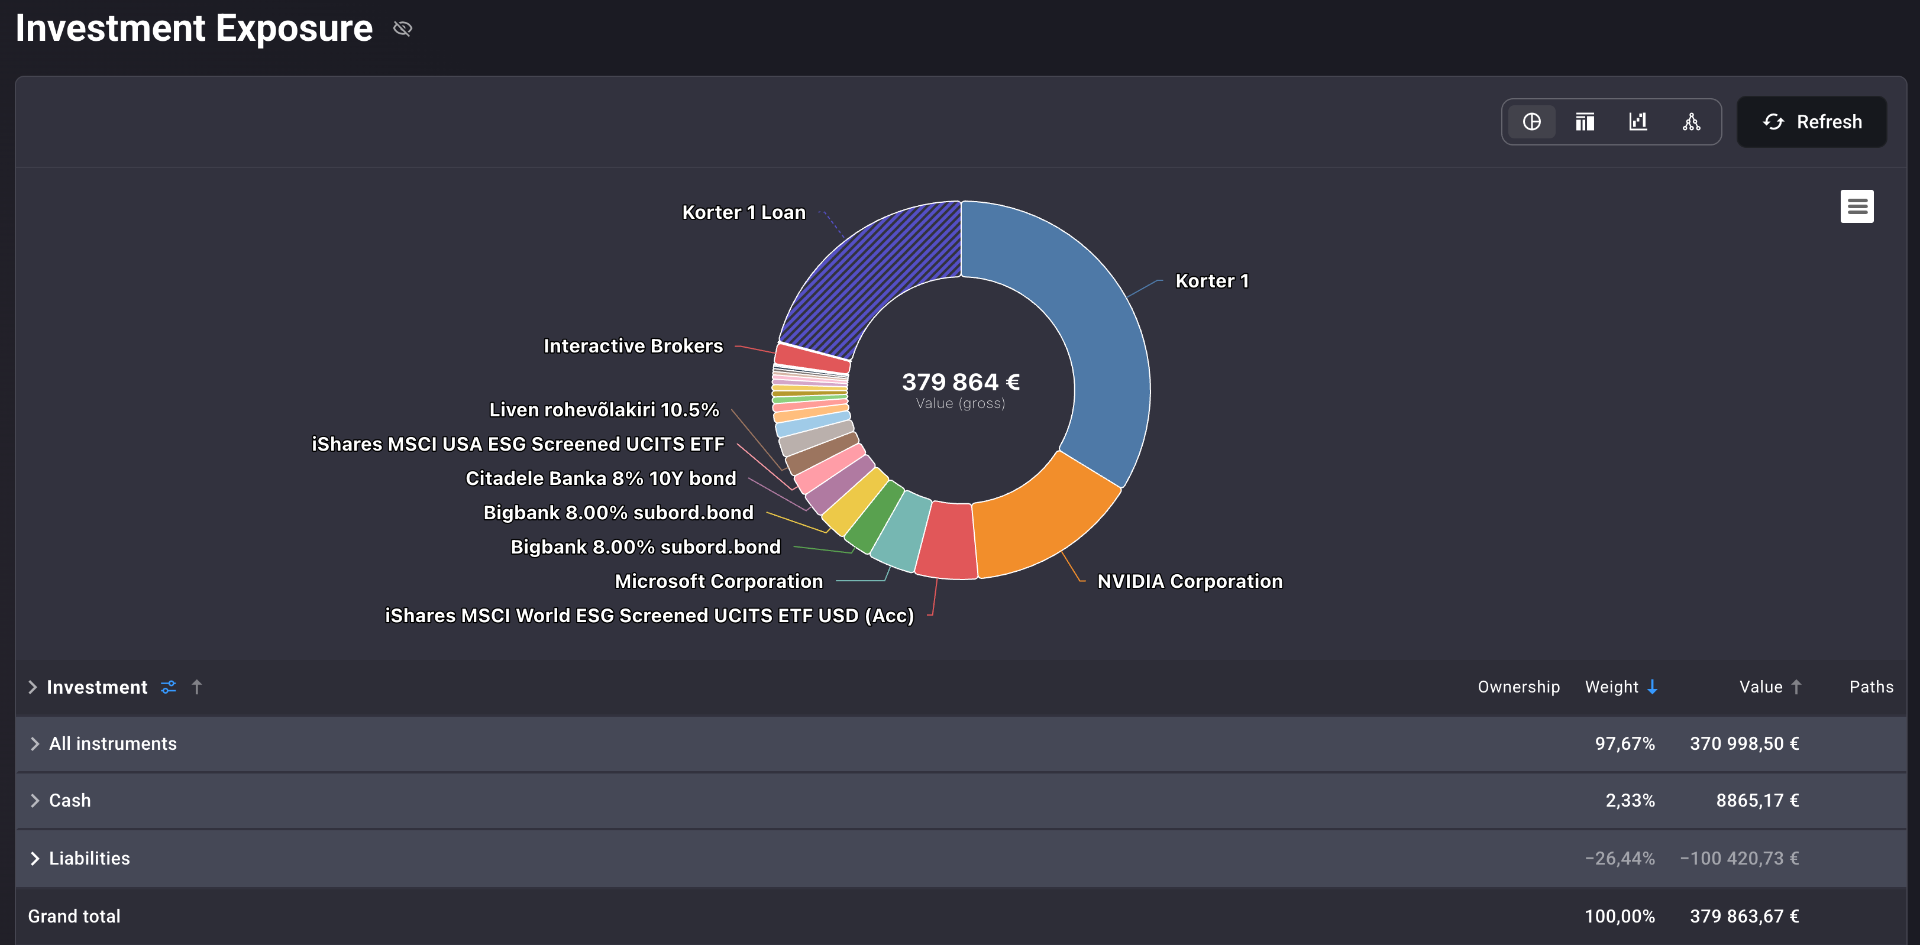
Every exposure is tagged with how it enters your portfolio. "Direct" is what you own outright. "3 Underlying" means three funds contribute to it. "Residual" is the unresolved tail of a fund. The colour-coded chips make it impossible to confuse a real holding with a passive one.
Sector, industry, country, region — automatically
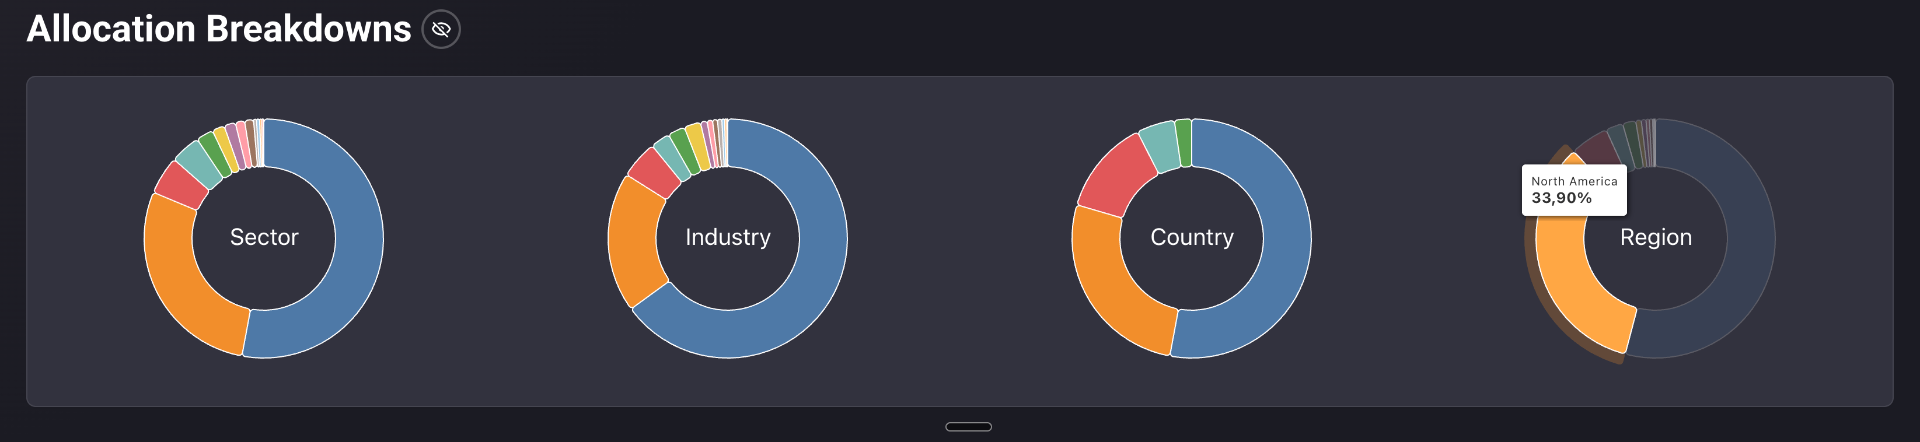
Four simultaneous donuts compute your true exposure across every dimension that matters, weighted by position size and resolved through every fund. No manual input. No spreadsheet. Just the answer to "where is my money actually deployed?"
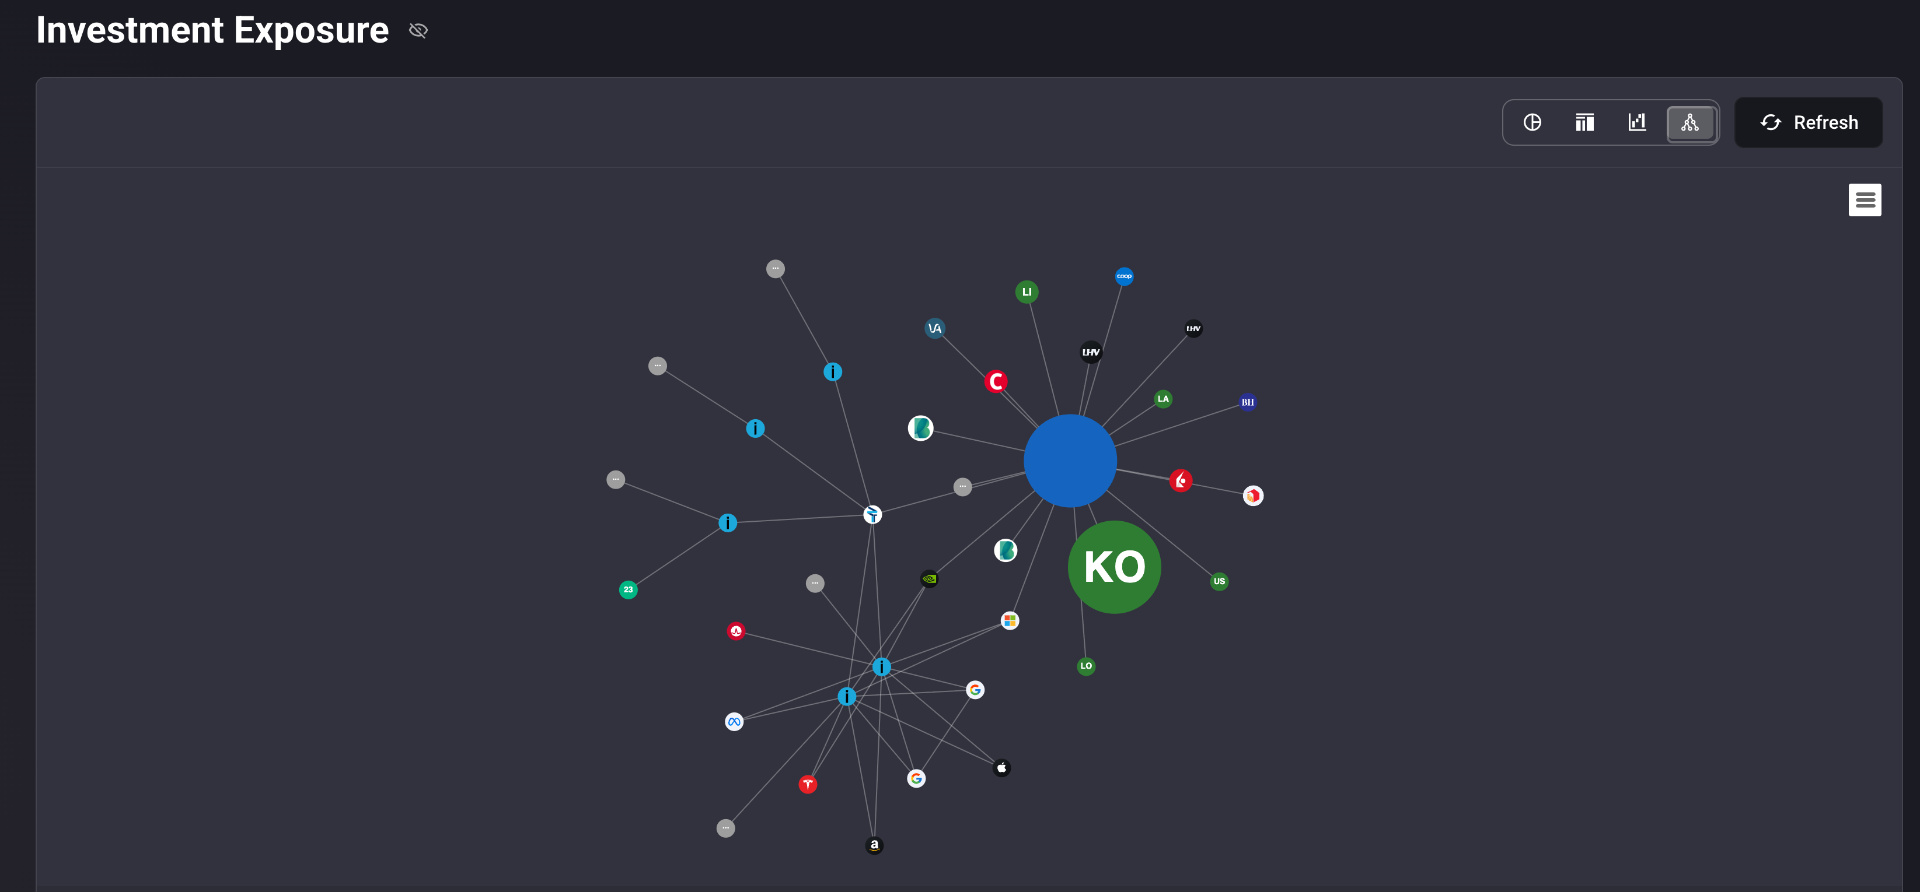
The overlap, drawn
A force-directed graph showing every instrument you hold and the underlying companies each one connects to. ETF overlap stops being abstract. It becomes a visible web — and the companies five different funds all point to are the ones you really own.
Built for the way fund portfolios actually work
Multi-fund overlap consolidation
Holdings shared across funds are summed into a single consolidated exposure. The headline figure is your real position.
Direct / Underlying / Residual / Grouped tags
Every row carries a colour-coded ownership tag, with a fund-count chip when the exposure comes through multiple funds.
Four chart views in one toolbar
Switch instantly between donut, ranked bar chart, treemap, and force-directed network graph. Same data, four lenses.
Auto sector / country / region donuts
Four allocation breakdowns calculated from your look-through data. No manual classification, no maintenance.
Ranked table with Paths drill-in
Click Paths on any exposure to see exactly which funds — and at what weight — contribute to it.
Works across every fund type
ESG funds, thematic ETFs, pension funds, real estate funds, and direct holdings — all resolved in the same view.
Every angle on your exposure
The same look-through data, rendered four different ways. The right view depends on the question you're asking.
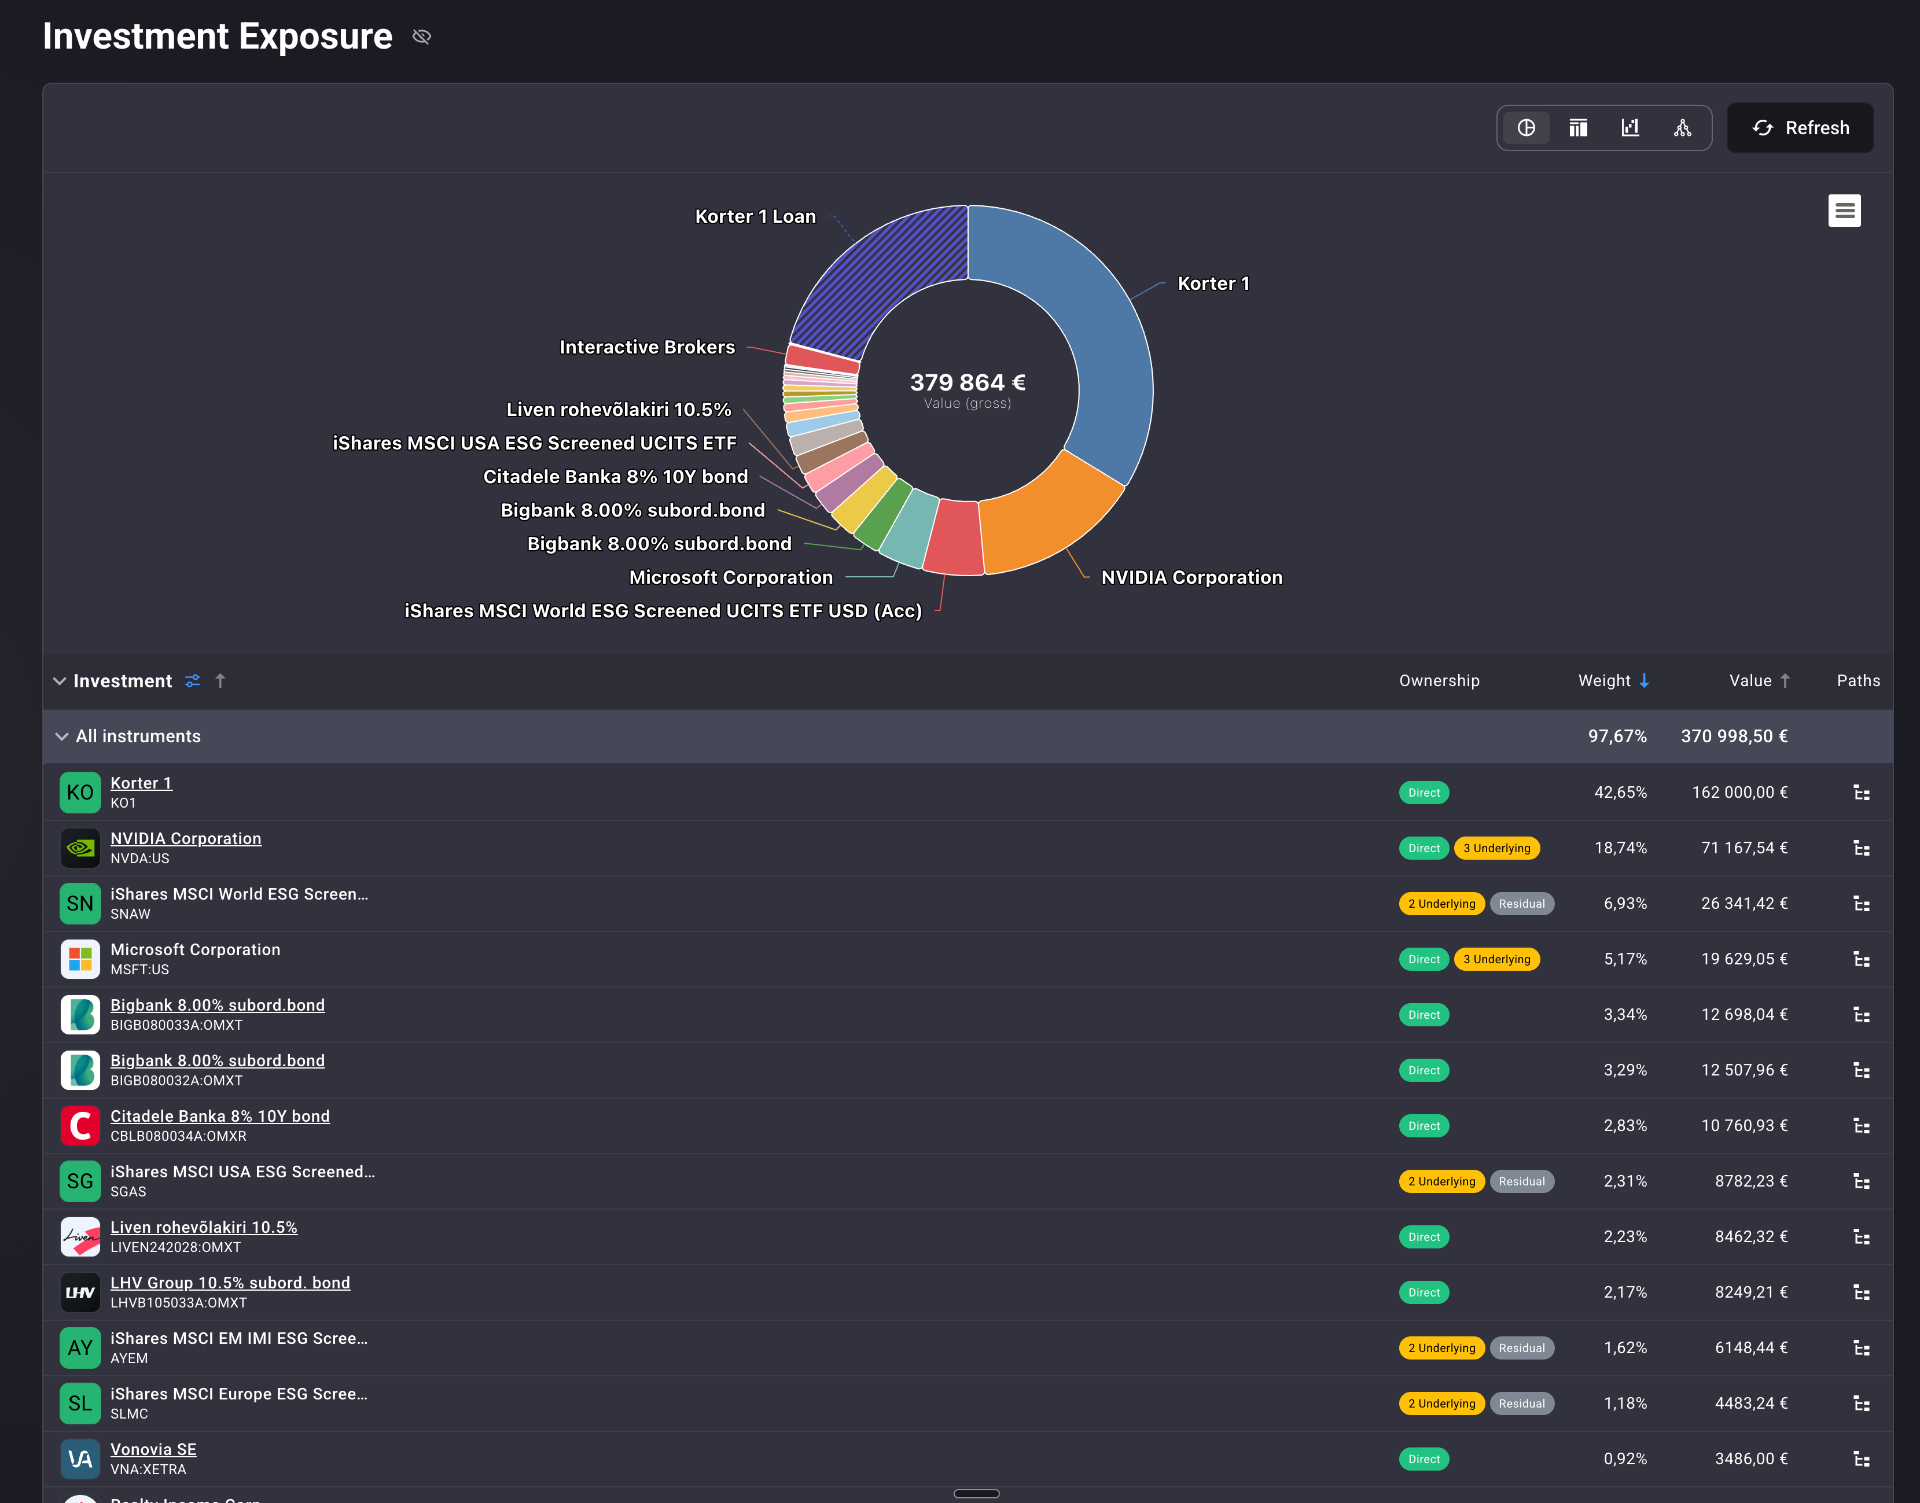
Gross exposure at the instrument level, in a single ring. The largest slices are where your real concentration sits.
Real-life use cases
The 19% NVIDIA discovery
Three ETFs and one direct holding all point to NVIDIA. Consolidated, it\'s nearly 19% of your gross portfolio. None of your individual fund views ever showed that number.
The North America check
Before adding a US tech ETF, you glance at the Country donut. North America is already 34%. You buy the EM fund instead.
The five-fund web
The network graph shows five different ETFs all pulling toward the same ten mega-caps. The diversification you suspected was missing — wasn't there.
Fits the way you actually invest
Core-satellite
A "core" of global ETFs often hides concentration in a handful of names. The look-through makes the core honest.
ESG-tilted stacks
Multiple ESG funds may overlap more than you expect. Resolve the overlap before you assume it isn't there.
Factor & thematic
Sector bets compound silently when several thematic ETFs lean the same way. The sector donut catches it.
Direct + funds hybrids
Direct holdings and fund holdings live in the same ranked view. Your real position in any company is one number, not four.
Brokers show what you bought. Portfellow shows what you own.
Most portfolio trackers stop at the fund label. You see VWCE, you see an ESG ETF, you see your direct stocks — and that\'s where the picture ends.
Portfellow goes one layer deeper. It opens every fund, resolves the underlying companies, adds up the overlap, and presents a single honest view of your real exposure — by company, by sector, by country, by region. No spreadsheet, no fund-holdings lookup, no guessing.
Suggested workflow
Eight minutes from "I think I'm diversified" to "I know what I own."
Add holdings
Connect or import every ETF, fund, and direct position into Portfellow.
Open the report
Investment Exposure resolves every fund and consolidates overlap automatically.
Read donut or treemap
Get the gross picture in one glance. Spot the largest exposures immediately.
Check ownership tags
See which exposures are direct, which come through funds, and how many.
Scroll to Allocation Breakdowns
Read sector, industry, country, and region concentration in one section.
Rank in the bar chart
Sort everything by weight to see the honest order of your real exposures.
Click Paths
Drill into any suspicious position to see which funds are contributing to it.
Decide your next buy
Add real diversification — or recognise that you'd be doubling down.