Will it last? Now you can actually know
Saving consistently is not a plan. The Retirement Planning report turns your live portfolio into a year-by-year projection — accumulation, peak, drawdown — with an explicit answer to the only question that really matters: when does the money run out?
For investors who need a real number
If "I'm probably on track" is the most precise answer you have to your retirement question, this report is for you.
Long-term investors without a formal plan
Actively contributing across multiple asset classes — but without a structured projection ever modelled to actual numbers.
Pre-retirees facing a real decision
A career change, an early retirement window, a property sale — and a need to translate the current trajectory into a concrete answer.
Anyone tired of generic calculators
You\'ve typed estimated balances into web calculators before. You want one that knows what you actually own.
Multi-asset investors
Equities, ETFs, bonds, real estate, cash — already consolidated in Portfellow, so the projection starts from a real baseline rather than a guess.
Generic calculators give you a number, not a plan
The retirement maths is straightforward. The inputs are the problem — and so is what gets shown in return.
They start with a number you typed in
Generic retirement calculators ask you to estimate your portfolio value. They don't know what you actually hold — and the projection is only as good as the guess that fed it.
A single rate misses the real shape of a life
One contribution rate. One withdrawal rate. A straight line to a target. Real financial lives have phases — accumulation, coast, drawdown — and a single-rate model can't represent any of them.
No explicit answer to "when does it run out"
Most tools surface a target number. Few tell you the year your portfolio reaches zero if your assumptions are even slightly off — which is the question that prompted the modelling in the first place.
Reassuring numbers, disconnected from reality
A nominal terminal value at age 90 looks comforting until you realise it hasn't been adjusted for inflation. A different headline and the same plan suddenly looks much tighter.
How the Retirement Planning report solves this
A live-portfolio baseline. A multi-phase questionnaire. A full-arc chart with an explicit Out of money year. And every projected month visible if you want it.
Live portfolio in. Real projection out.
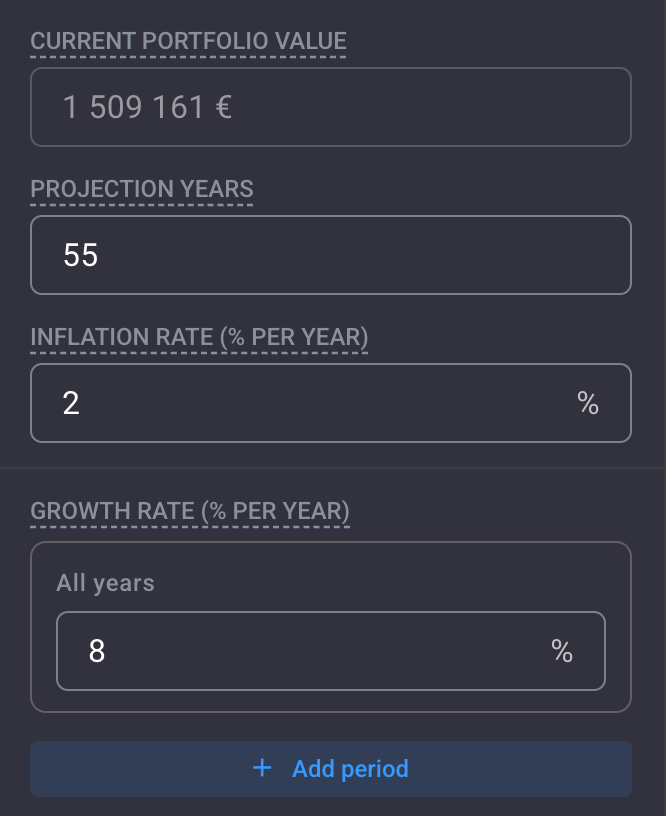
The current portfolio value is pre-filled directly from your live Portfellow holdings — equities, ETFs, real estate, bonds, cash, the lot. No manual estimate. No stale balance from last quarter.
Set the projection horizon (out to 2080 if you want), the expected inflation rate, and a growth rate that can be split by period. The accumulation rate from years 1–10 doesn't have to match the rate you assume after retirement.
Accumulation, peak, and drawdown — in one view
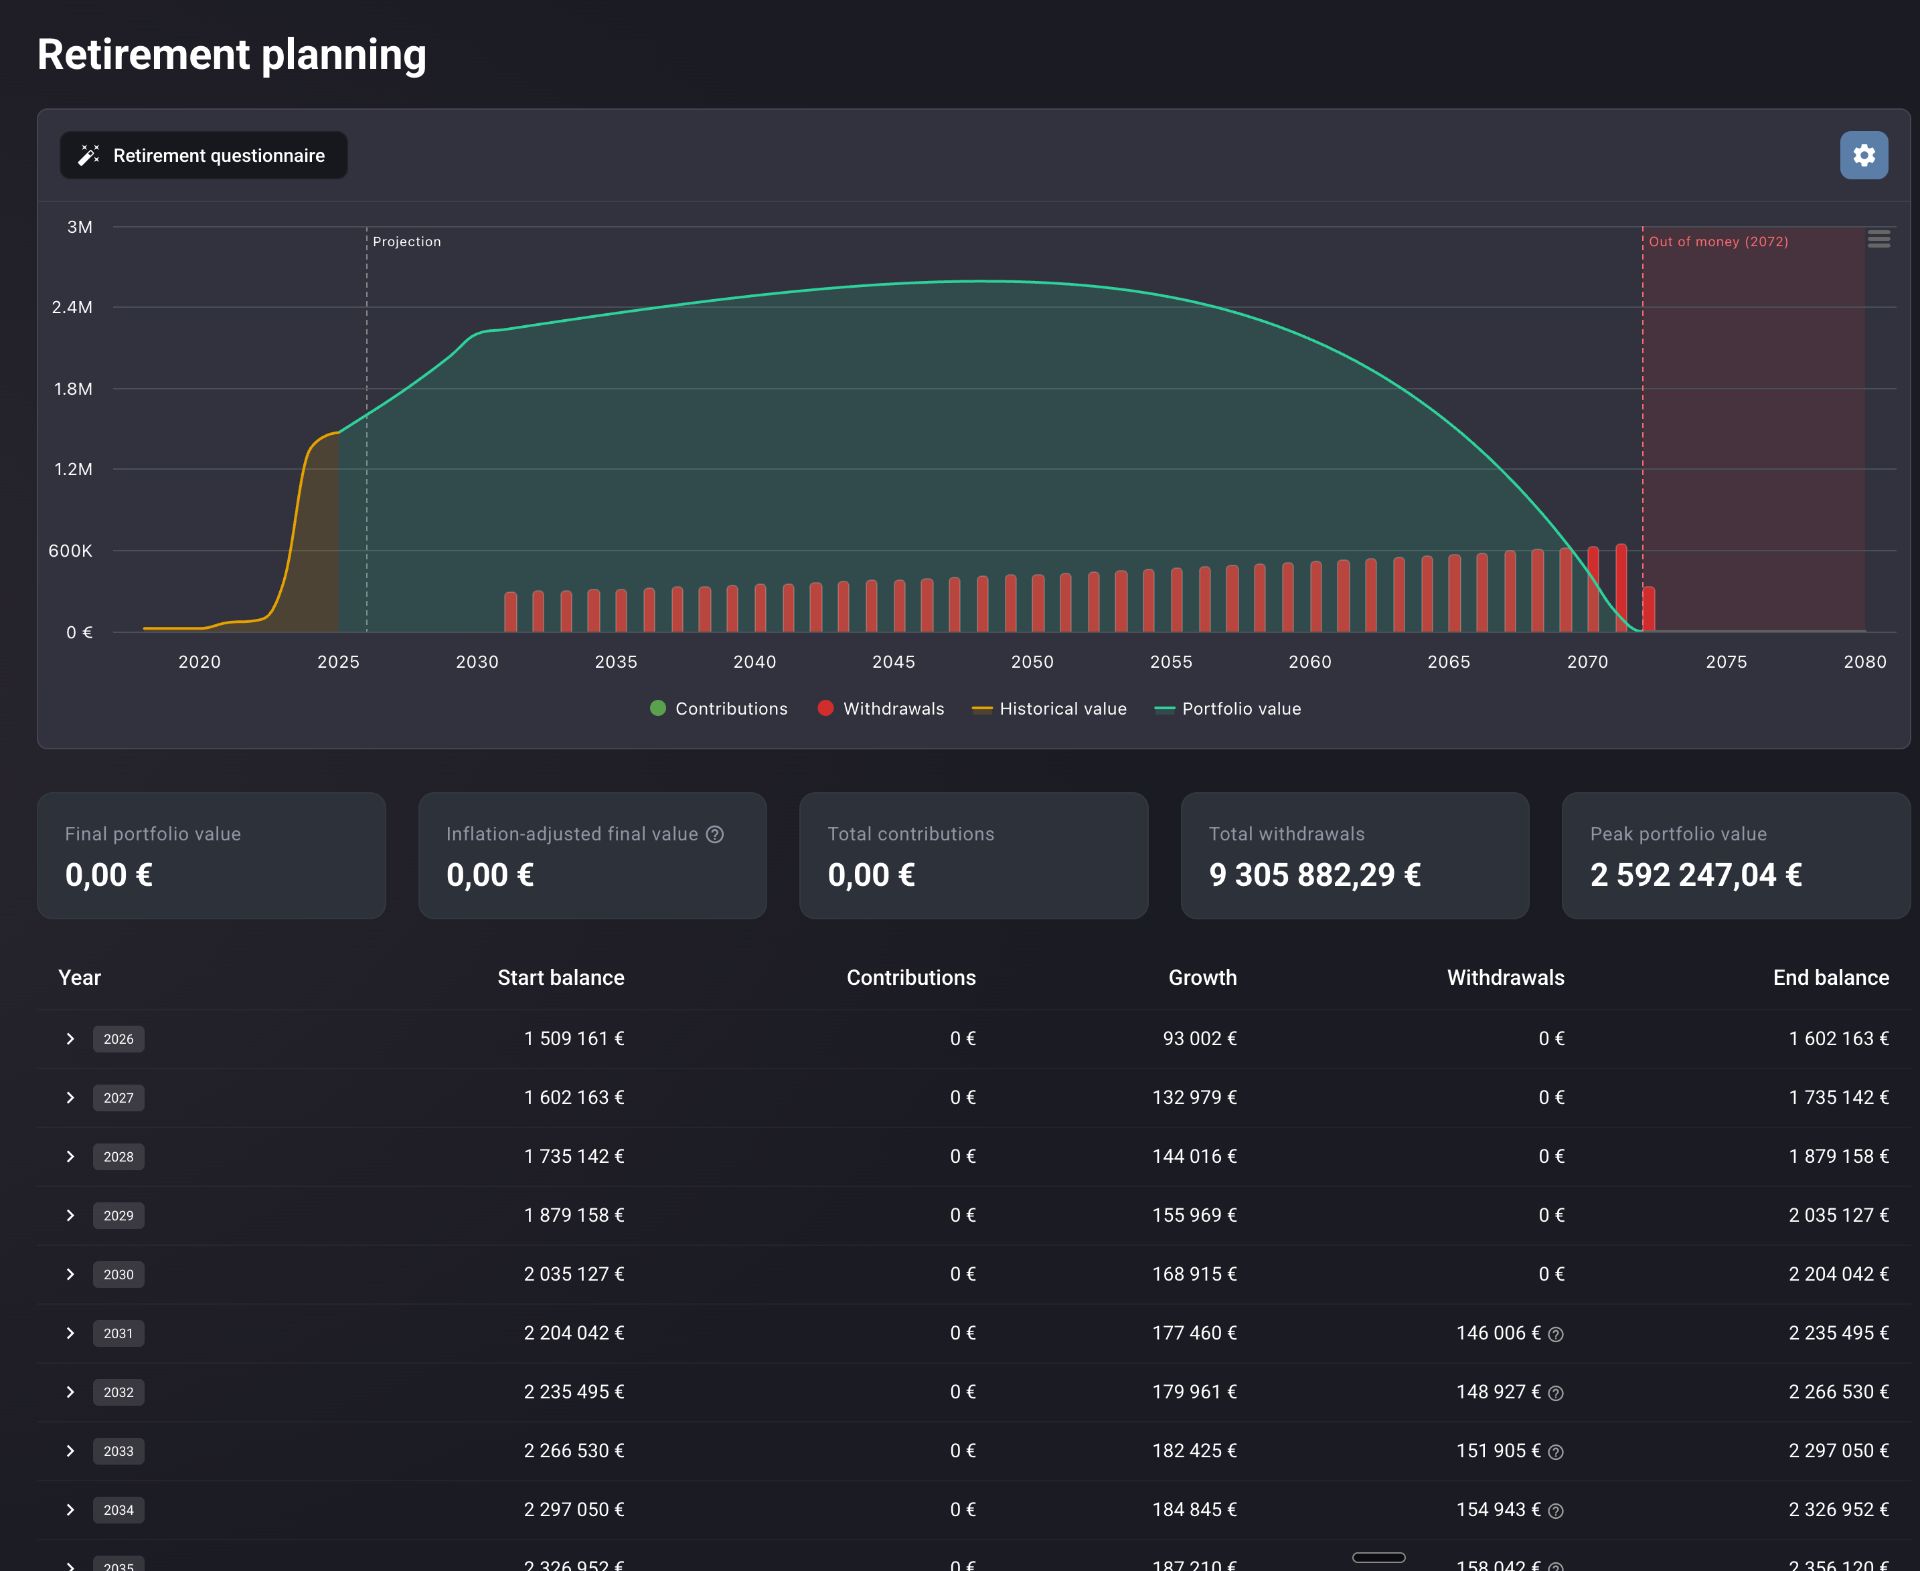
A single chart spans your historical portfolio value (yellow), projected forward as a teal area through the accumulation peak and into the drawdown years. Withdrawals appear as red bars over the years they happen.
A vertical dashed line marks today. A red Out of money marker appears at the year the portfolio reaches zero — making the sustainability question impossible to miss. In the example above, that year is 2072.
The five numbers that frame the plan
Below the chart, five cards distil the entire projection to its essentials. The numbers you'd want to repeat back if someone asked you whether you were on track.
The inflation-adjusted final value sits next to the nominal one for a reason. Real purchasing power is the figure that actually matters at the end of a 50-year horizon — and it's almost always the more sobering of the two.
Every year. Every month, if you want.
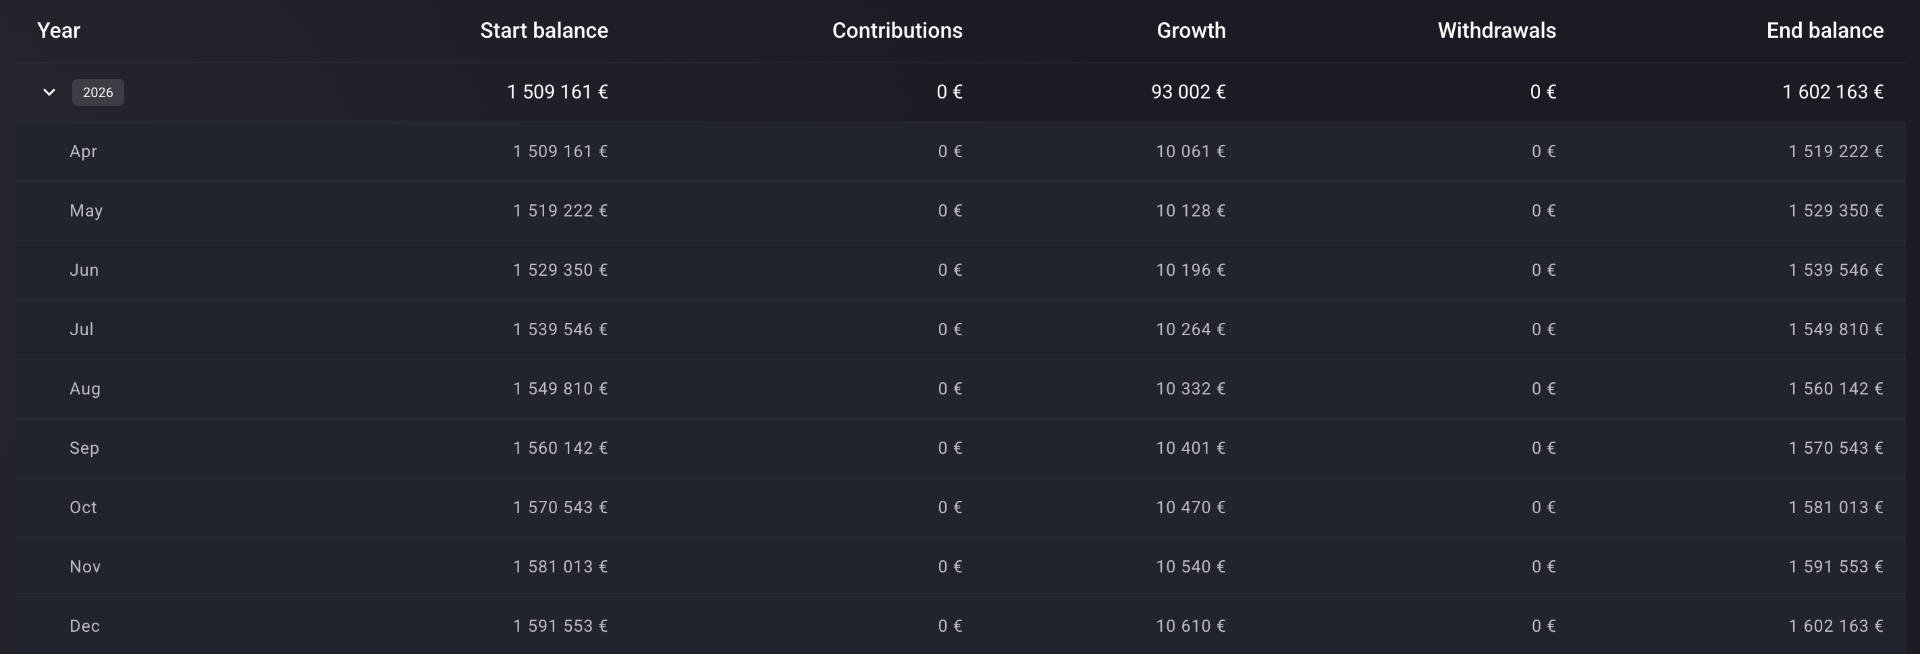
A collapsible table lists every projected year from today to the end of the horizon. Each row shows the start balance, contributions, growth, withdrawals, and end balance — the arithmetic, on the page.
Expand any year to see the monthly breakdown within it. The compounding is visible at the level you want to look at it. No calculator black box, no "trust the model" handwave.
Built for the actual shape of a financial life
Live portfolio as the baseline
Current value is pre-filled from your real holdings. Not an estimate. Not last quarter's number.
Multi-period contributions and withdrawals
Configure growth, contribution, and withdrawal rates by phase via "Add period" — accumulation, coast, drawdown, all in one run.
Projection horizon to 2080
Long enough for any realistic retirement scenario, including the years past the typical life expectancy.
Explicit Out of money marker
When the portfolio reaches zero, the year is marked on the chart in red. Not a footnote. Not a small print.
Inflation-adjusted final value
Real purchasing power surfaced as a headline stat — the figure that actually matters across decades.
Yearly table with monthly drill-down
Inspect any year's month-by-month progression to verify the arithmetic — or to spot the inflection.
Works across every asset class held in the portfolio — equities, ETFs, listed and unlisted bonds, real estate, loans, crowdfunding, VC funds, crypto, and cash accounts.
Every angle on the projection
The questionnaire is where the model gets its shape. Each surface configures a different lever.
Current portfolio value (pre-filled), projection years, inflation rate, and growth rate. The growth rate can be split by period if you expect it to shift in later years.
Real-life use cases
A 30-second answer to a 30-year question
A 6% annual withdrawal rate from retirement marks the portfolio Out of money in 2072. Drop the rate to 4.5% and the projection extends indefinitely. The model change takes thirty seconds. The decision it informs lasts decades.
Modelling a career change at 45
Contributions drop to zero for three years, then resume at a reduced rate. The accumulation curve flattens visibly. The new peak portfolio value is lower — and the chart tells you exactly by how much, and what it means for the drawdown phase.
The headline that hides the real story
Nominal terminal portfolio value looks healthy. The inflation-adjusted figure tells a different story — real purchasing power is significantly lower. Useful prompt to revisit the assumed growth and inflation rates before locking in a retirement date.
Fits any retirement strategy
Whether you're decades from drawdown or already in it, the model represents your phase — and the next ones.
Accumulation-phase investors
See how compounding and contributions build toward a peak — and what level of contribution actually matters at the margin.
Coast-FIRE strategists
Stop contributions at a chosen point and let the portfolio grow unassisted. Modellable in two clicks via a zero-contribution period.
Early retirement planners
Stress-test an aggressive withdrawal rate against a long horizon. The Out of money year is the answer to a question that was previously impossible to ask precisely.
Traditional retirees
Year-by-year transparency into how the portfolio declines under a chosen withdrawal pace — with monthly drill-down for the years that matter most.
Why Portfellow is different
A retirement projection is only as honest as the inputs it starts from — and the answers it's willing to put on the chart.
Generic retirement calculators
- ·Starting balance is a number you typed in
- ·Single contribution rate, single withdrawal rate
- ·A target value at retirement — but no Out of money year
- ·No connection to your actual holdings
- ·Inflation often hidden in the assumptions tab, not the headline
Portfellow
- Starting balance is your live, unified portfolio
- Multi-period contribution and withdrawal modelling
- Out of money marker, on the chart, in the year it happens
- Every asset class — equities, ETFs, real estate, bonds, cash
- Inflation-adjusted final value as a headline stat
Suggested workflow
Eleven steps, end to end — from a live portfolio to a year-by-year projection.
- 1Add all accounts and instruments to Portfellow so the current portfolio value is accurate.
- 2Open the Retirement Planning report.
- 3Launch the Retirement questionnaire.
- 4Confirm the pre-filled current portfolio value.
- 5Set projection years, inflation rate, and growth rate — use "Add period" if you expect the growth rate to shift later.
- 6Set monthly contributions by phase — accumulation years, coast years, or zero.
- 7Set the withdrawal rate by phase — zero during accumulation, then your planned drawdown rate from retirement.
- 8Read the chart for the full arc — accumulation, peak, drawdown, and the Out of money year if one appears.
- 9Review the five summary stats for the headline numbers.
- 10Scroll the year-by-year table and expand individual years to inspect the monthly compounding.
- 11Adjust assumptions — lower the withdrawal rate, extend the contribution phase, or change the growth rate — and refresh.