A rising balance isn't the same as a real return
If you've added or withdrawn money during the period, the percentage your broker shows you isn't your return. The Portfolio Performance Report measures it the way it should be measured — money-weighted, across every account, alongside the benchmarks you could have held instead.
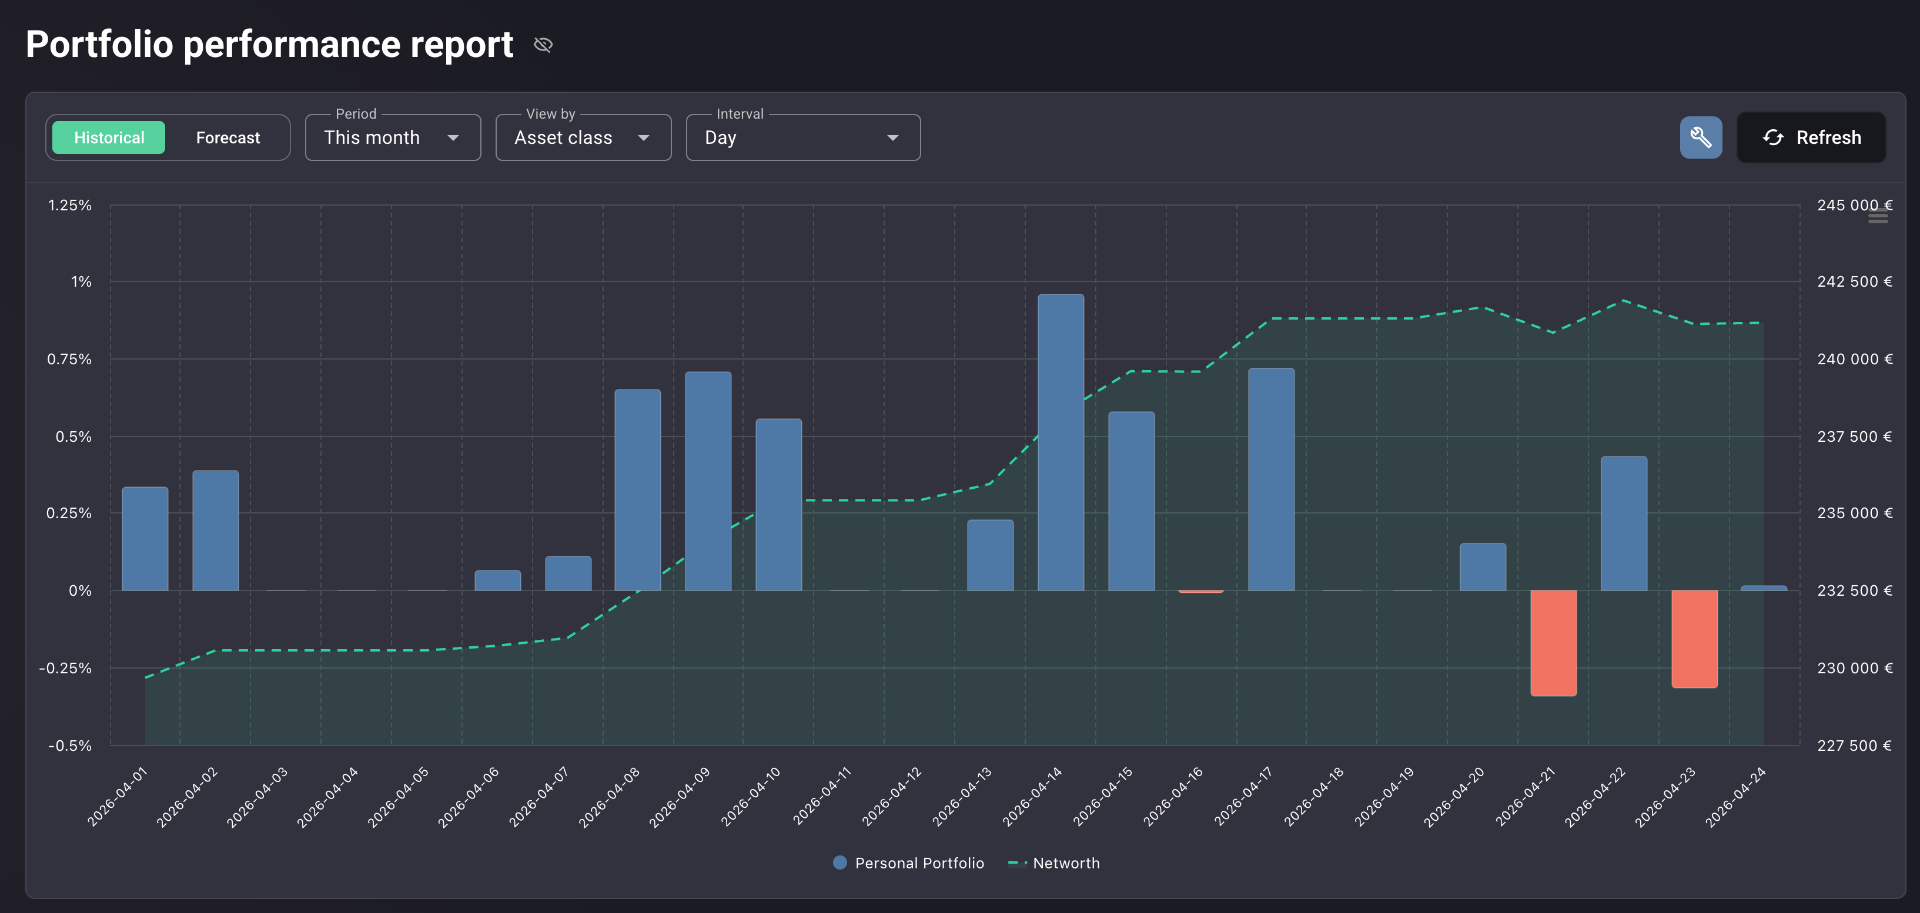
For investors who want one honest number
If you've ever wondered whether you're actually beating the market — or whether it just feels that way because you've been adding money — this report is for you.
Multi-broker investors
Assets spread across two, three, or five brokers — and no single number that captures the whole portfolio's return.
Anyone who deposits or withdraws
The moment cash flows in and out mid-period, simple percentage change stops telling the truth. You need money-weighted math.
Investors asking "am I beating the index?"
You've compared your number to the S&P 500 before. You've never been sure the comparison was fair.
Anyone unsure their broker's math is comparable
Two platforms, two return numbers, two methodologies. You want one figure, calculated the same way as the benchmark.
The return you think you earned
A growing balance is not a return. The number that matters has to account for what you put in, what you took out, and exactly when.
Broker apps quote cost-basis return
A simple percentage from cost basis ignores when your money entered the portfolio. Add a large deposit before a rally, and the figure flatters you. Add it before a dip, and it punishes you. Either way, it's not your return.
A well-timed deposit looks like skill
Doubling down at the bottom looks brilliant on a price-return chart. Money-weighted return tells you whether the timing actually paid — and by how much.
Comparing to the S&P 500 is meaningless if the math differs
Your broker's number, the index's number, and another platform's number are usually calculated three different ways. Putting them next to each other is a vibe, not a comparison.
Drawdown and volatility stay buried
The numbers that tell you how much you suffered to earn your return are rarely surfaced at all. A 12% return with a 35% drawdown is not the same as a 12% return with a 6% drawdown.
How the Portfolio Performance Report solves this
One report. One methodology. Risk shown next to return. Benchmarks calculated on identical terms.
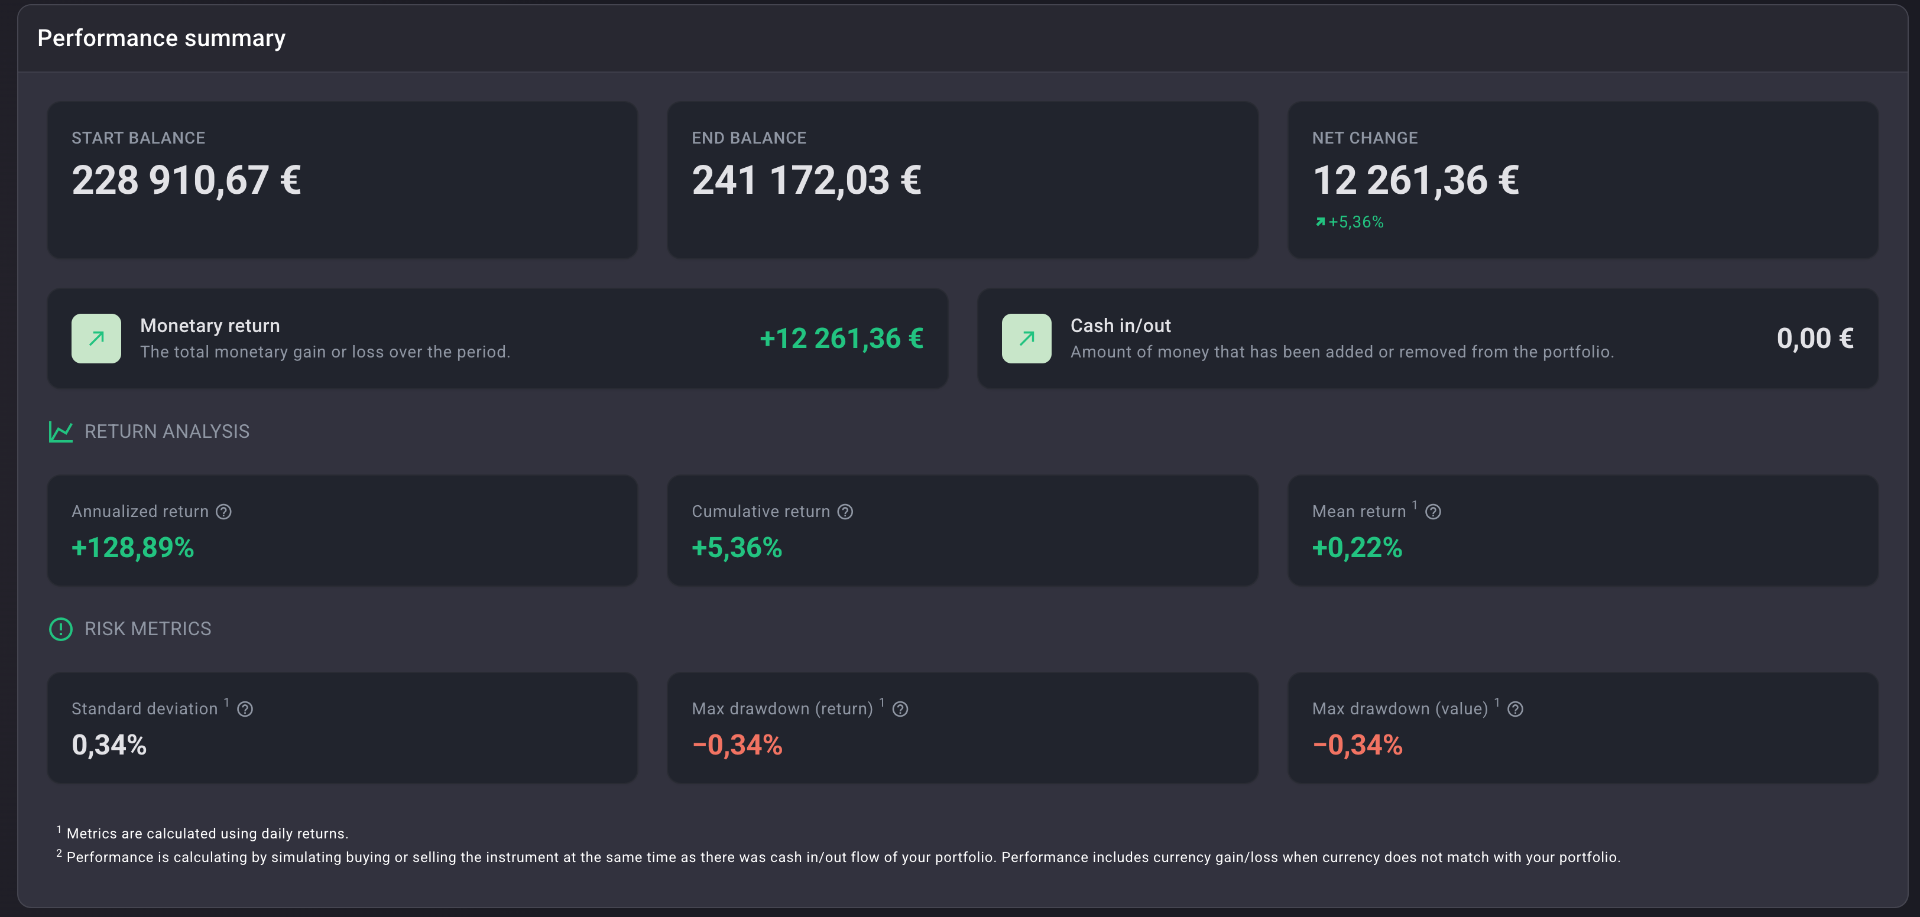
One honest number — and the arithmetic behind it
XIRR weights every cash flow by its timing and size. The Performance Summary panel makes the arithmetic visible: what you started with, what you ended with, what you actually earned, and what you added or withdrew. Return Analysis and Risk Metrics sit alongside, not in a footnote — annualized, cumulative, mean daily, standard deviation, and max drawdown in one place.
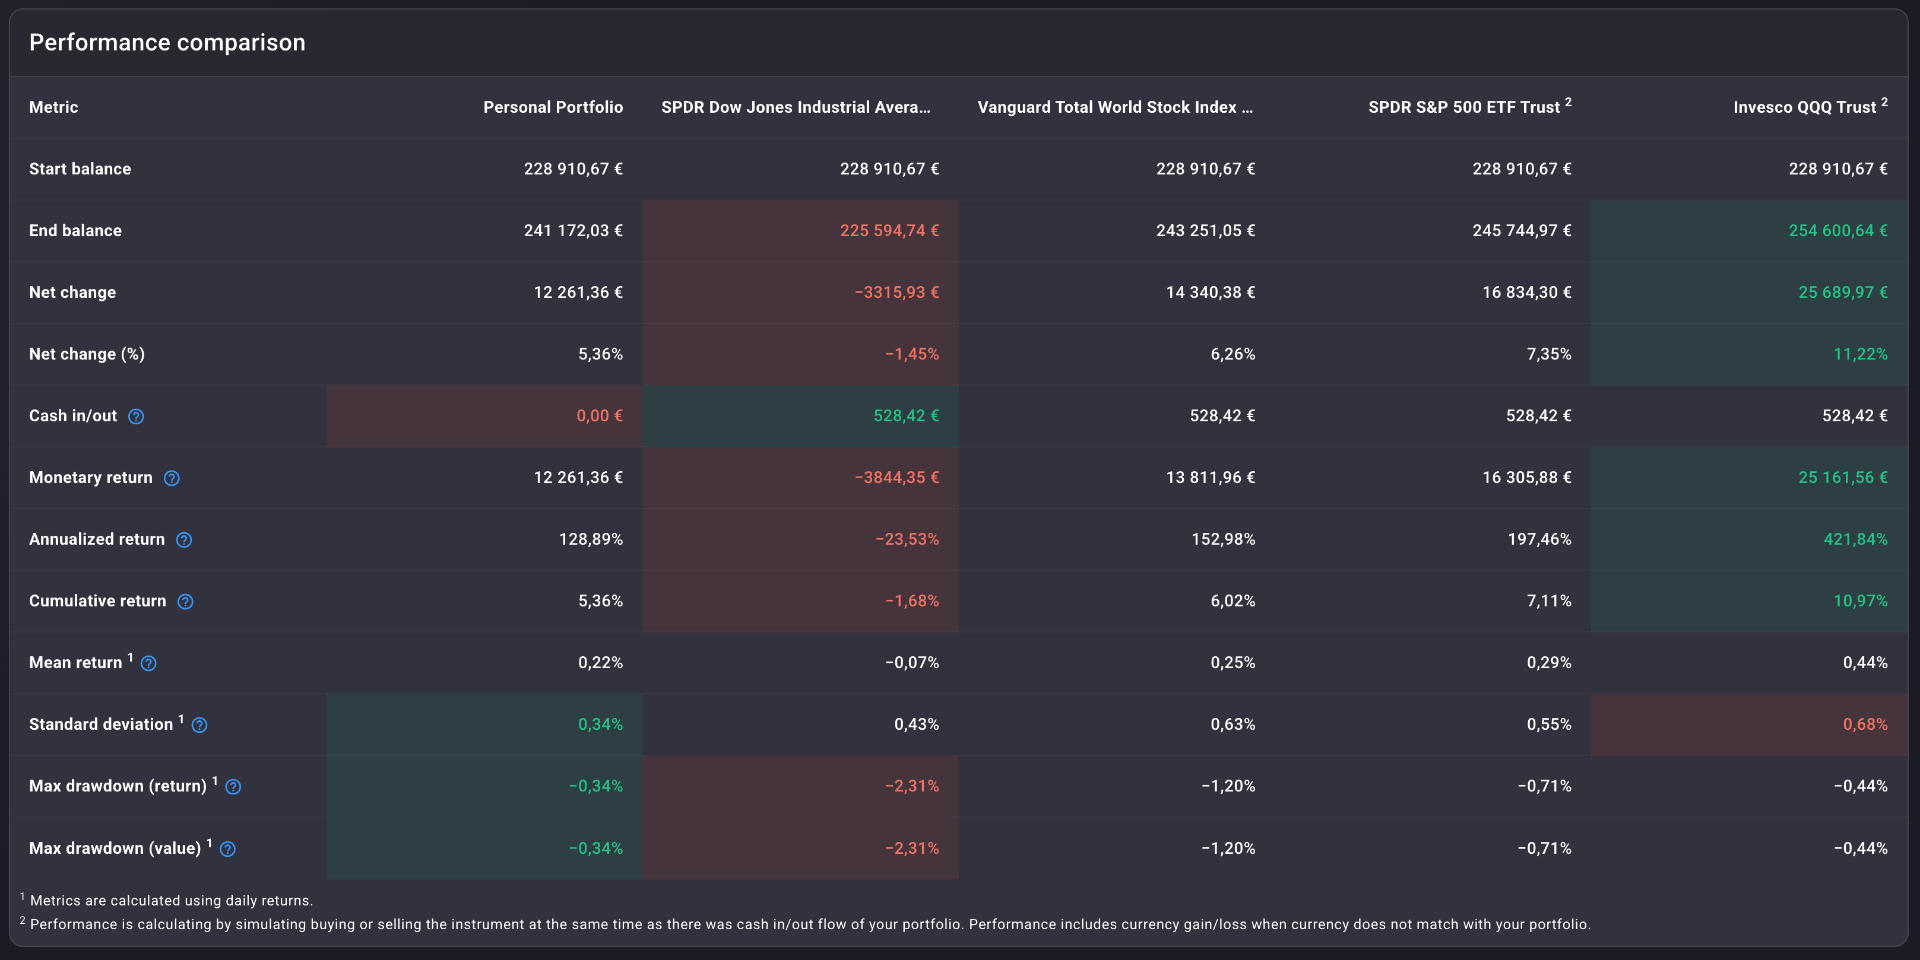
Benchmarks, calculated on your terms
Your portfolio sits next to SPDR Dow Jones Industrial Average, Vanguard Total World Stock Index, SPDR S&P 500, and Invesco QQQ — every metric, every row, side by side. Green and red mark where you led and where you lagged. The benchmark figures use the same XIRR math, applied to a hypothetical investment in each index made at the same times and in the same amounts as your own cash flows.
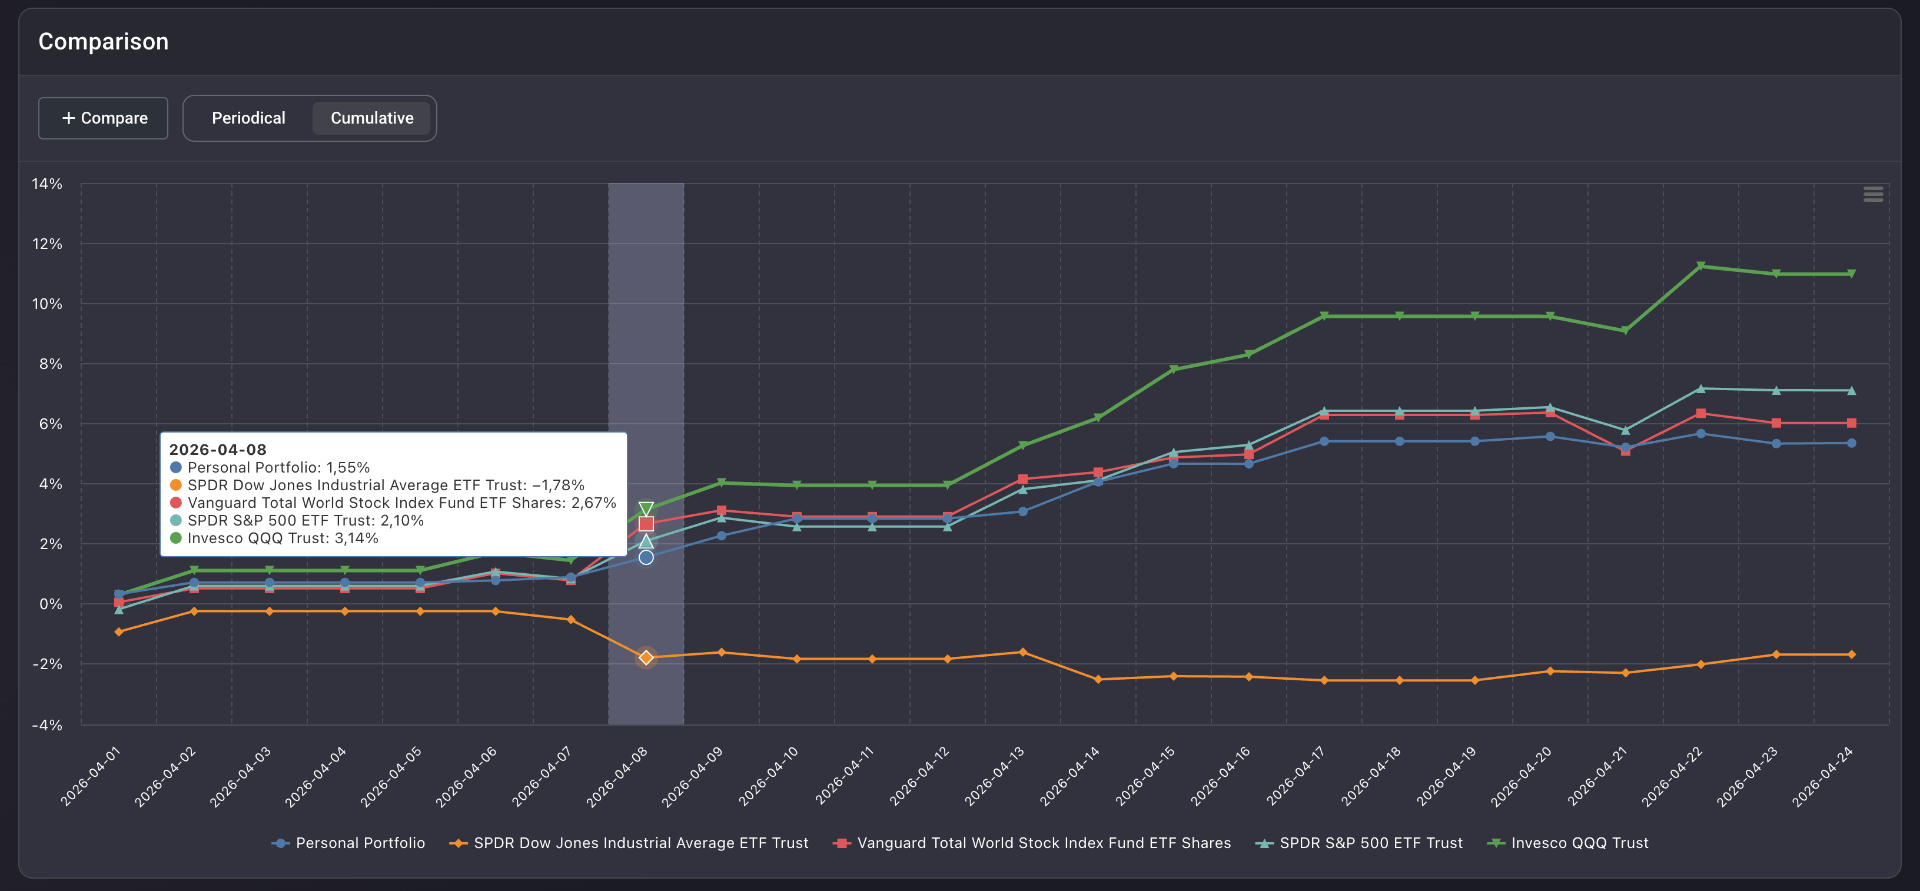
Where the gap opened. Where it closed.
Switch the comparison chart between Periodical (daily return bars grouped side by side) and Cumulative (line chart) from a single toggle. Hover to read the exact figure for any series on any day. The eight-month period where you tracked the index — and the week you didn't — both become visible.
Forecast — with uncertainty visible
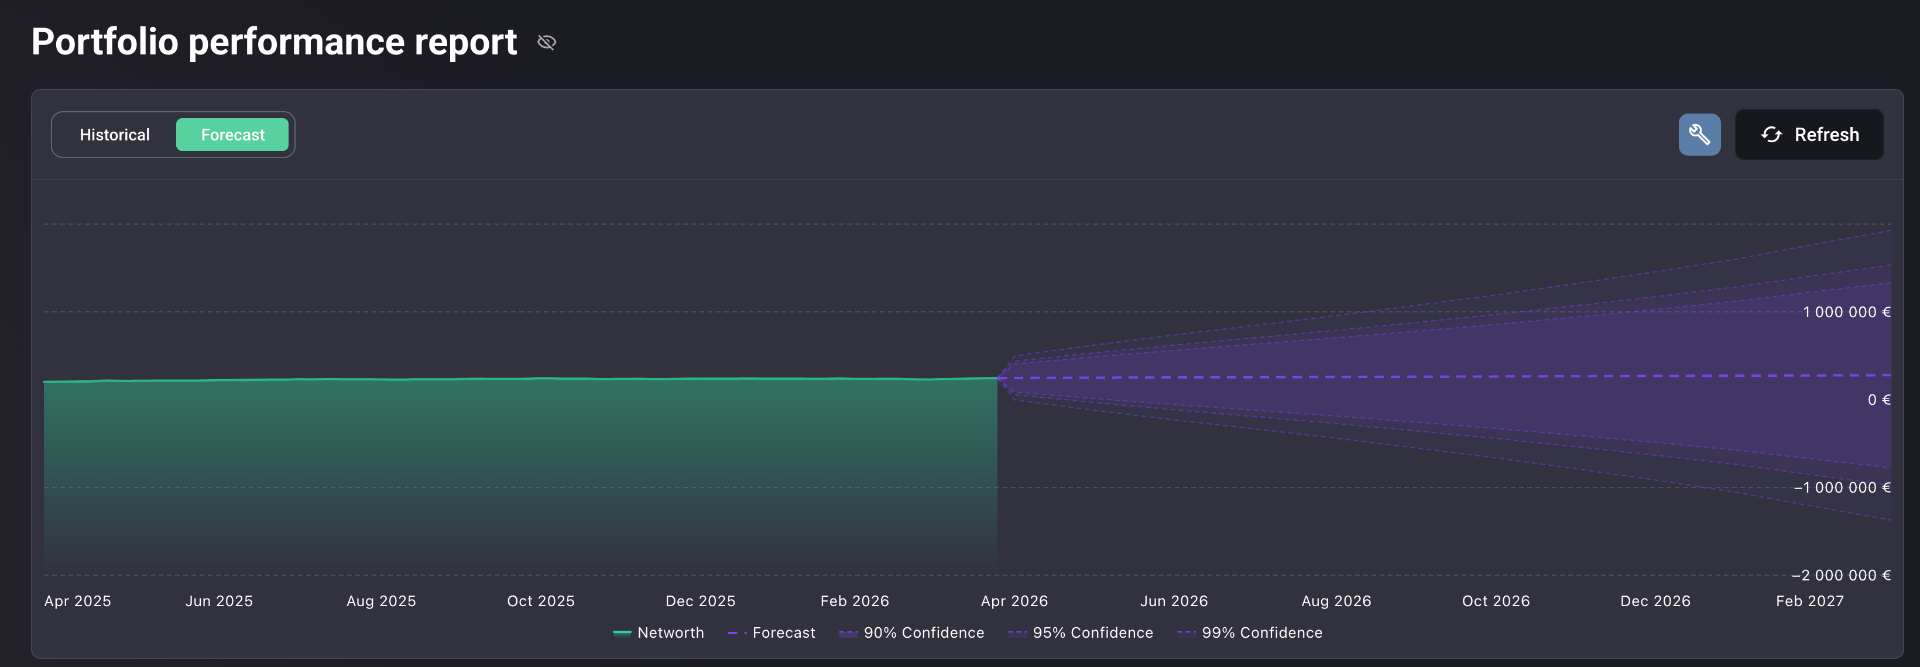
Toggle from Historical to Forecast and the chart becomes a Monte Carlo probability fan: net worth projected at 90%, 95%, and 99% confidence. The fan widens with time. Uncertainty isn't hidden behind a single line — it's the picture.
Built to measure return the way it should be measured
XIRR over any custom date range
Year-to-date, since inception, last quarter, custom window. The methodology stays the same — only the period changes.
Performance Summary panel
Start balance, end balance, net change, monetary return, and cash in / out. The arithmetic is on the page, not behind it.
Return Analysis cards
Annualized return, cumulative return, and mean daily return — the three figures that translate between short windows and long horizons.
Risk Metrics panel
Standard deviation of daily returns, max drawdown as a percentage, and max drawdown as an absolute value. Risk next to return — always.
Benchmark comparison table
Up to four indices side by side, every metric, with green and red colour coding so the lead and the lag are immediately readable.
Forecast with confidence fan
Monte Carlo projection at 90 / 95 / 99% confidence, built from your historical return and volatility — across every asset class you hold.
Every angle on your performance
The same XIRR figure, rendered five different ways. The right view depends on the question you're asking.
Daily return bars (positive blue, negative red) overlaid with the net worth curve. Where the portfolio gained and lost ground, day by day.
Real-life use cases
The two-point gap
Three deposits across the year. Money-weighted return: 5.4% — a full two percentage points below the broker's quoted figure. The simple math missed a large deposit made just before a drawdown.
Beat the Dow, lagged the Nasdaq
On the benchmark table: ahead of the Dow Jones, behind the Nasdaq 100 by 5.7 percentage points annualized. A gap that was invisible while comparing different platforms' return calculations.
The eight-month tracking line
In the Cumulative view, the portfolio tracked the S&P 500 almost exactly for eight months. Then a single concentrated position moved — and the line diverged sharply.
Fits the way you actually invest
Buy-and-hold annual reckoning
Once a year, set the date range to the calendar year and read your honest return next to the index you could have held instead.
Active rebalancers and traders
XIRR reflects timing. Frequent rebalancing and tactical trades are weighted by when they happened, not just by the price they printed.
Goal-driven investors
Use Forecast mode to project your historical return and volatility forward. The fan tells you whether the goal is within reach — and at what confidence.
Multi-broker investors
Assets across multiple brokers and accounts contribute to a single unified return number. One figure for the whole portfolio.
Same methodology for your portfolio and the benchmark
Most broker apps measure return from cost basis. Most portfolio trackers pick a methodology and don't tell you which one. Either way, the figure isn't comparable to the index you'd like to measure yourself against.
Portfellow uses XIRR — the same money-weighted standard institutional investors use — across every asset class and every account simultaneously. The benchmark comparison is not decorative. It is the same math, applied to a hypothetical investment in each index, made at the same times and in the same amounts as your own cash flows. The number you see is comparable because the arithmetic is identical.
Suggested workflow
Nine steps from "I think I'm doing well" to "I know what my portfolio actually returned."
Add accounts
Connect or import every broker, account, and asset class into Portfellow.
Open the report
Portfolio Performance loads in one click. XIRR runs across the whole portfolio automatically.
Set the date range
Year-to-date, since inception, last quarter, or any custom window.
Read the summary
Start balance, end balance, monetary return, cash in / out — the plain-English version of the period.
Review return analysis
Annualized, cumulative, and mean daily return on a single screen.
Check risk metrics
Standard deviation and max drawdown tell you what you suffered to earn the return.
Scan the benchmark table
Compare every metric against four major indices, calculated on identical terms.
Toggle Periodical / Cumulative
See where the gap to the benchmark opened — and where it closed.
Forecast forward
Project your historical return and volatility into the future at 90 / 95 / 99% confidence.