Feature

    Your broker shows you a return. It's not necessarily yours.

    Time-weighted returns ignore when your money actually moved. Portfellow calculates money-weighted XIRR instead β€” the number that reflects what you actually earned.

    Performance Tracking in Portfellow

    One number, and it's flattering you

    The return your broker shows and the return you actually earned are often two different numbers.

    Time-weighted returns flatter, not inform

    The standard return calculation ignores the timing of your deposits β€” so a lump sum invested right before a rally looks identical to one invested a year earlier.

    "How am I really doing" has no single answer

    Total return, annualized return, this year versus all-time β€” without the right metric for the right question, you're just guessing.

    No risk context alongside the number

    A high return with wild swings isn't the same as a high return with a steady climb, but most trackers only show you one of the two.

    Key highlights

    Money-weighted (XIRR) return calculations

    Portfolio-level and individual investment tracking

    Benchmark comparison tools

    Flexible date range selection

    Risk metrics including volatility and drawdown

    Deep dive

    Your real return, not a flattering one

    Most brokers show you a time-weighted return β€” a number that ignores when you actually put money in. Portfellow calculates money-weighted return (XIRR) instead, which accounts for the exact timing and size of every deposit and withdrawal. It's a more honest answer to 'how am I actually doing?'

    You're not stuck with one method either β€” switch between XIRR, CAGR, or a simple linear return depending on what you're trying to understand.
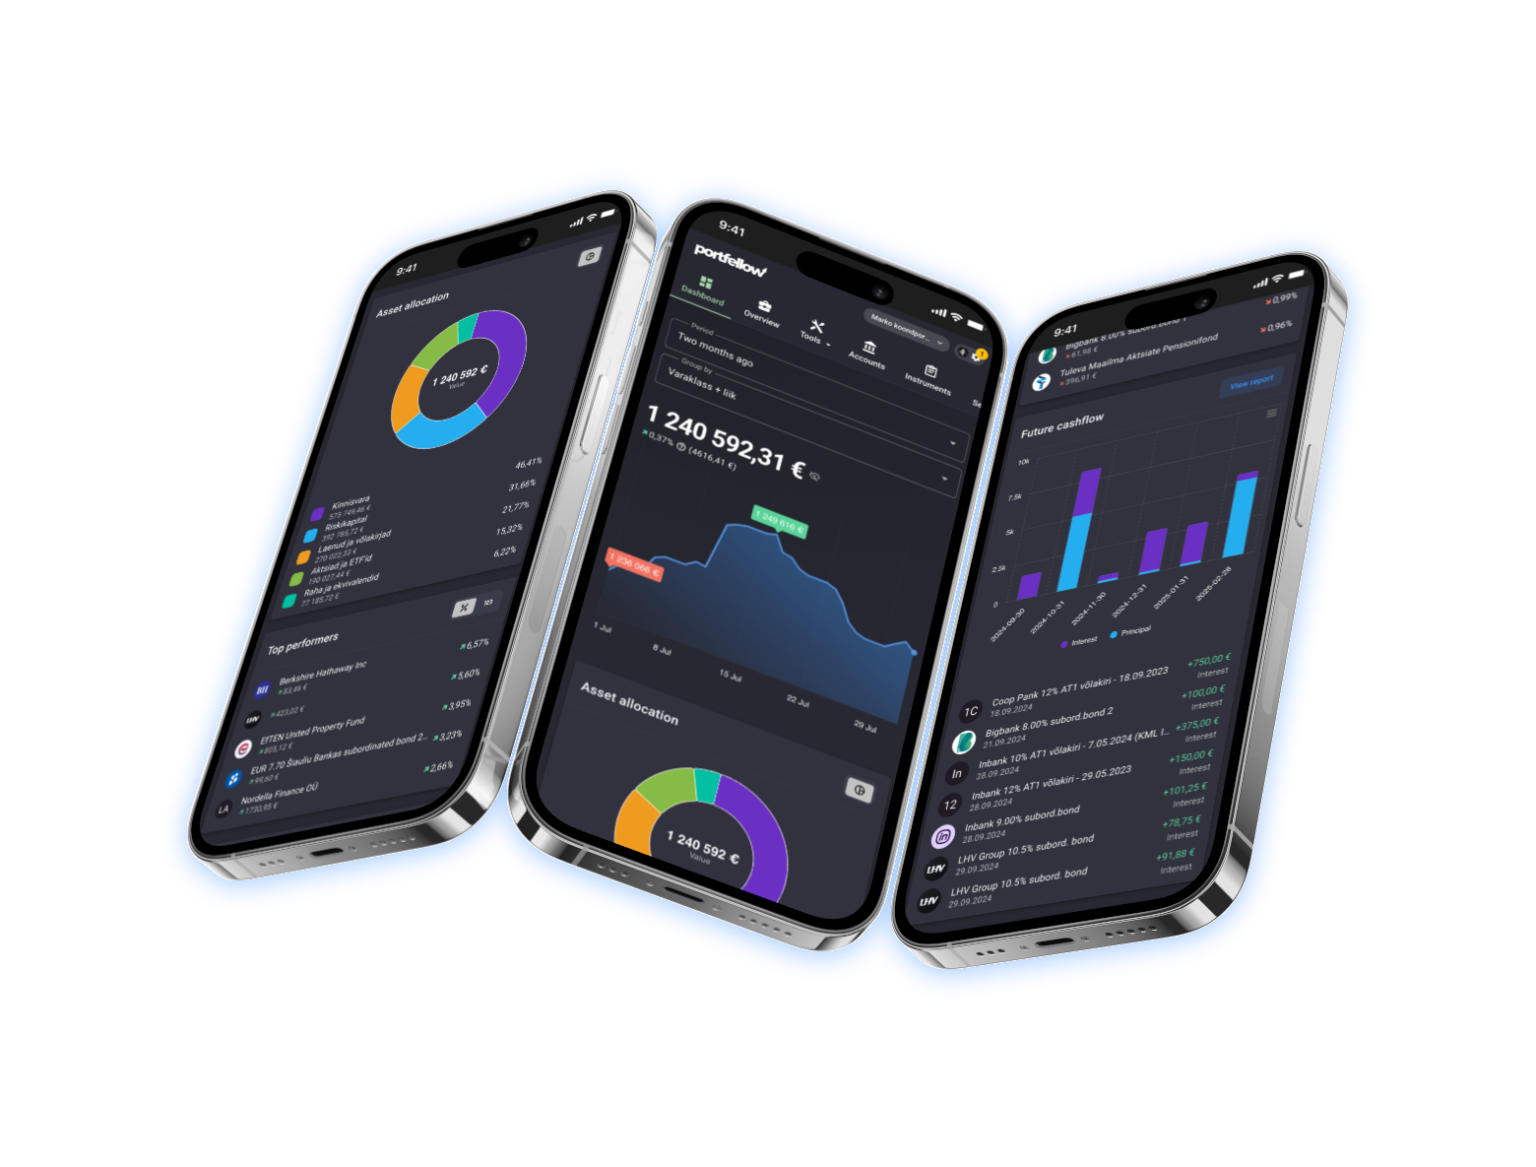
    Money-weighted portfolio performance tracking in Portfellow

    Zoom in or zoom out

    View performance for your whole portfolio, a single account, an asset class, or one specific holding β€” the same money-weighted math applies at every level. Pick any date range, from the last month to your full investment history.

    Compare your results against major market benchmarks to see whether your picks β€” or your patience β€” are actually paying off.

    Risk, not just return

    A high return with wild swings isn't the same as a high return with a steady climb. Portfellow surfaces volatility and drawdown alongside your returns, so you can see the ride, not just the destination.

    Dividend and cash-flow forecasts project the income your current holdings are on track to generate β€” useful for planning, never a promise of what will actually happen.

    How it works

    1. 1

      Every transaction, timestamped

      Deposits, withdrawals, trades, and dividends are all captured with the date and amount that actually happened.

    2. 2

      Pick your lens

      Filter by portfolio, account, asset class, or single holding, and any date range you want.

    3. 3

      Compare and understand

      See your money-weighted return, risk metrics, and how you stack up against a benchmark β€” all in one view.

    Built for

    The XIRR purist

    Wants the real, money-weighted number β€” not a marketing-friendly return that ignores when cash actually moved.

    • Money-weighted XIRR as the default metric
    • CAGR and linear return available when useful
    • Volatility and drawdown alongside returns

    The long-term tracker

    Cares less about daily noise and more about whether the whole portfolio is compounding the way it should, year over year.

    • Full-history performance in one chart
    • Benchmark comparison to check the strategy
    • Dividend forecasts for future income planning

    Frequently asked questions

    Know your real return, not a flattering one.

    Money-weighted XIRR, risk metrics, and benchmark comparison β€” the metrics that actually answer how you're doing.