Built for serious stock pickers
If you hold individual equities across more than one broker — and care whether you're really beating the index — this is for you.
Active stock pickers
10–40 conviction names you've researched yourself, held across multiple markets and time horizons.
Multi-broker users
Interactive Brokers, Lightyear, your local bank broker — all fragmented into separate dashboards today.
Cross-border investors
US, European and Baltic positions in different currencies. FX noise muddies your real return.
DIY benchmark watchers
You want to know — honestly — whether you should just be buying SPY or VWCE instead.
The problem with judging your own performance
Every broker tells you a different story. None of them tell you the truth.
Fragmented brokers
IBKR shows one return, Lightyear another, your bank a third. There is no unified view of what you actually own — let alone how it's performing.
Inconsistent return math
Time-weighted, money-weighted, simple gain — every broker picks one and rarely the right one. You can't compare returns that aren't computed the same way.
Currency noise
A 12% USD return becomes 4% in EUR after FX. Most trackers hide this. Your real return — net of currency — is the only one that matters.
Hidden sector concentration
You think you're diversified. Then you realize 38% of your book is tech because of the underlying ETF holdings nobody surfaces for you.
How Portfellow solves this
Four reports that answer the only question that matters: is your stock-picking working?
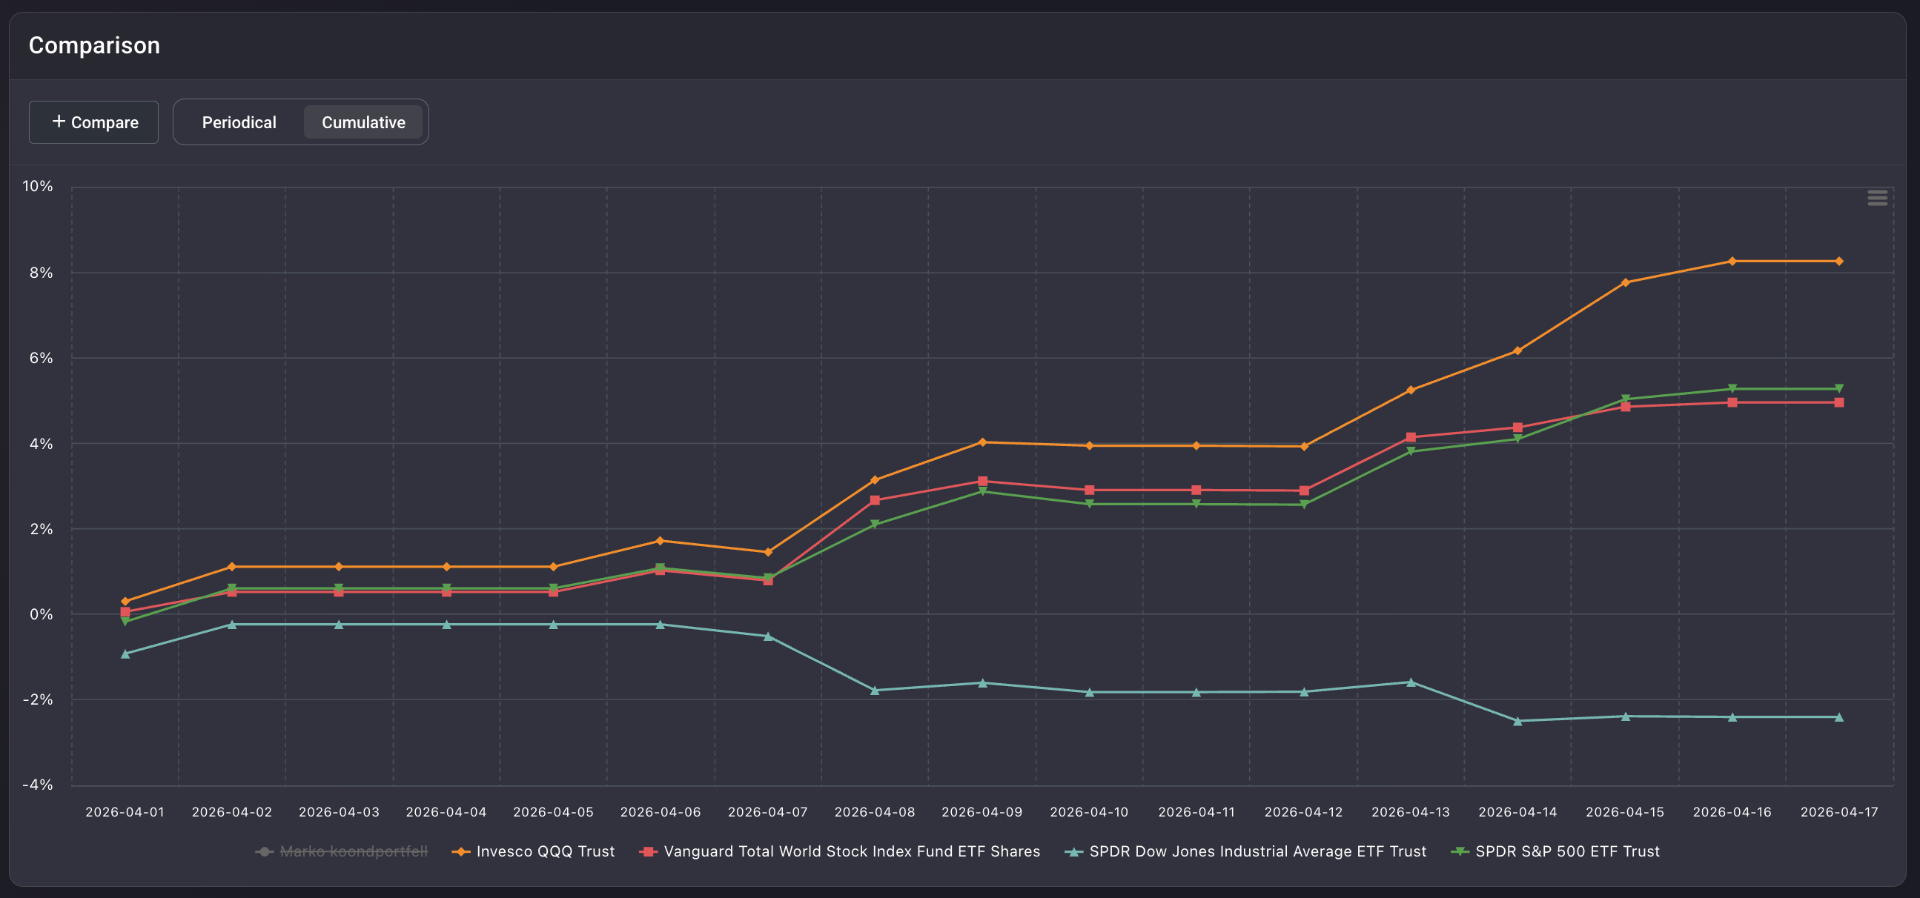
Honest benchmark comparison, baked in
Plot your portfolio against S&P 500, Nasdaq 100, Dow Jones and Vanguard Total World on the same chart, over any date range. Money-weighted, FX-normalized — the comparison is finally apples-to-apples.
Learn more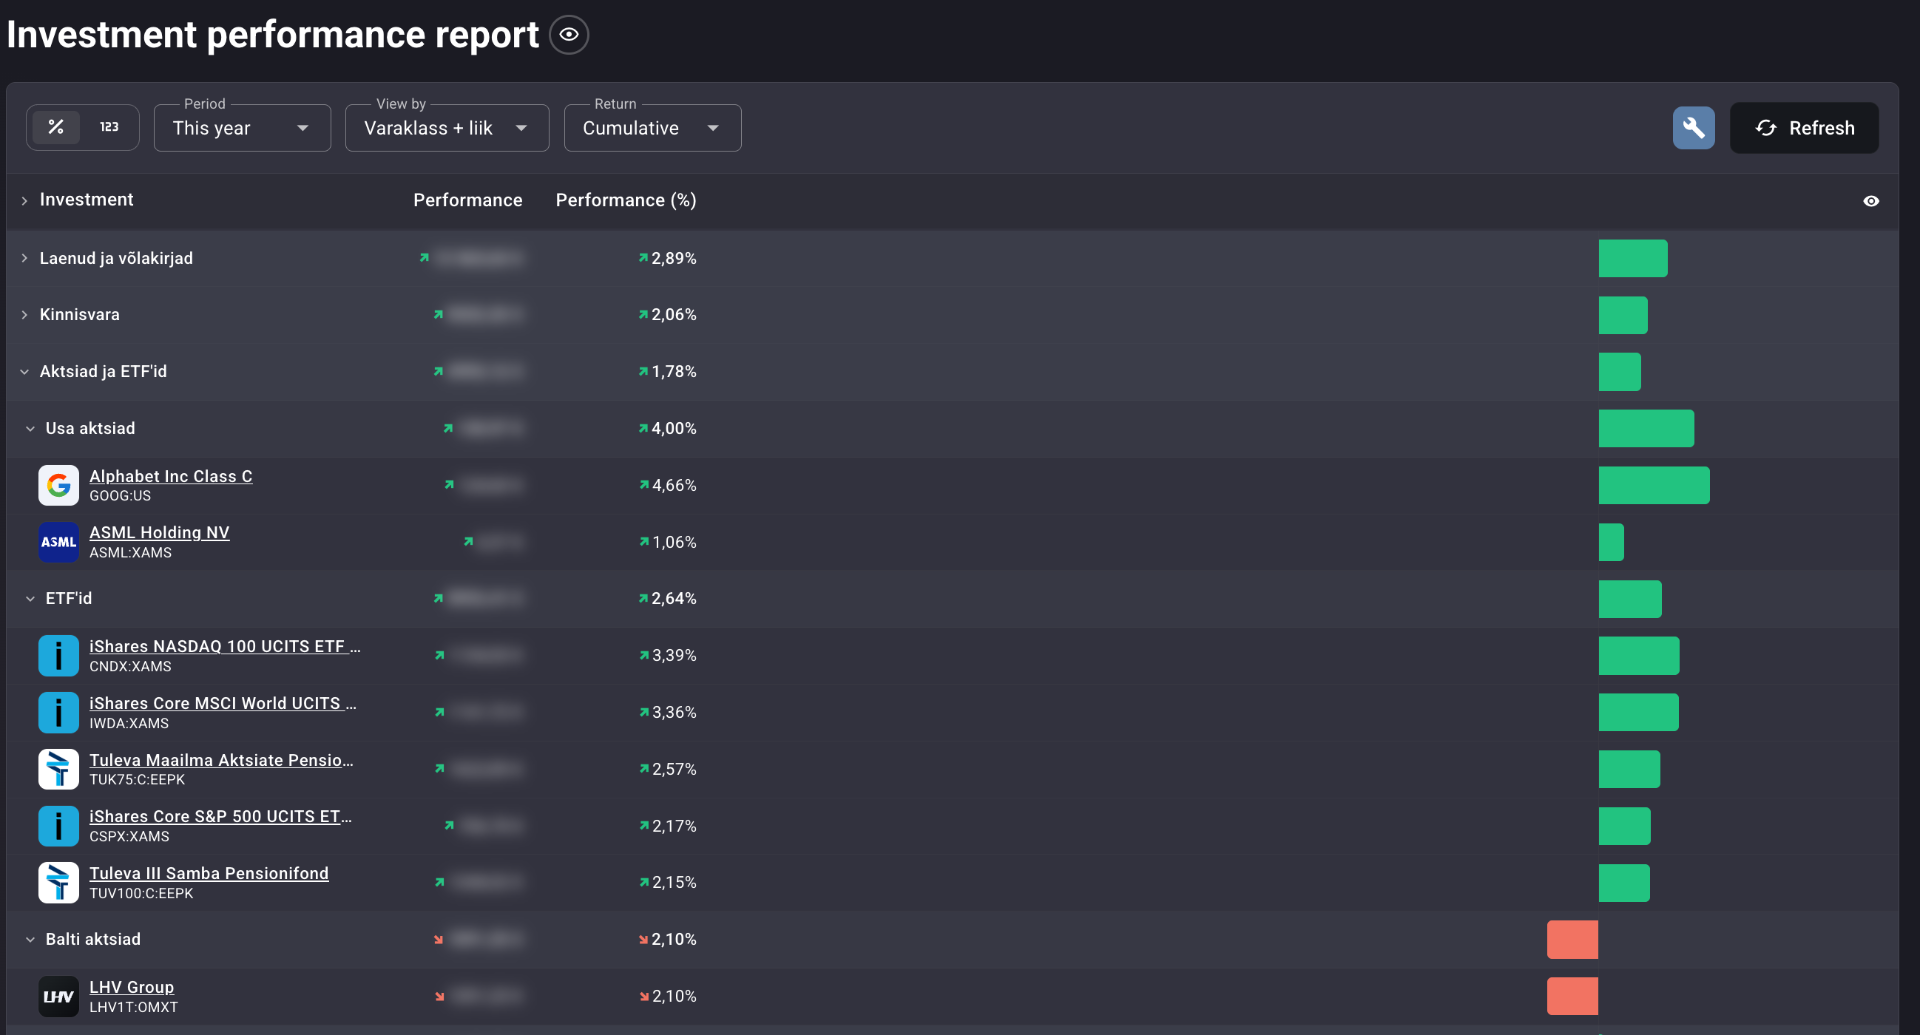
Every position ranked by what it really earned
See every individual stock ranked by cumulative or annualized return, grouped by asset class or market. Spot the winners propping up your portfolio — and the deadwood quietly dragging it down.
Learn more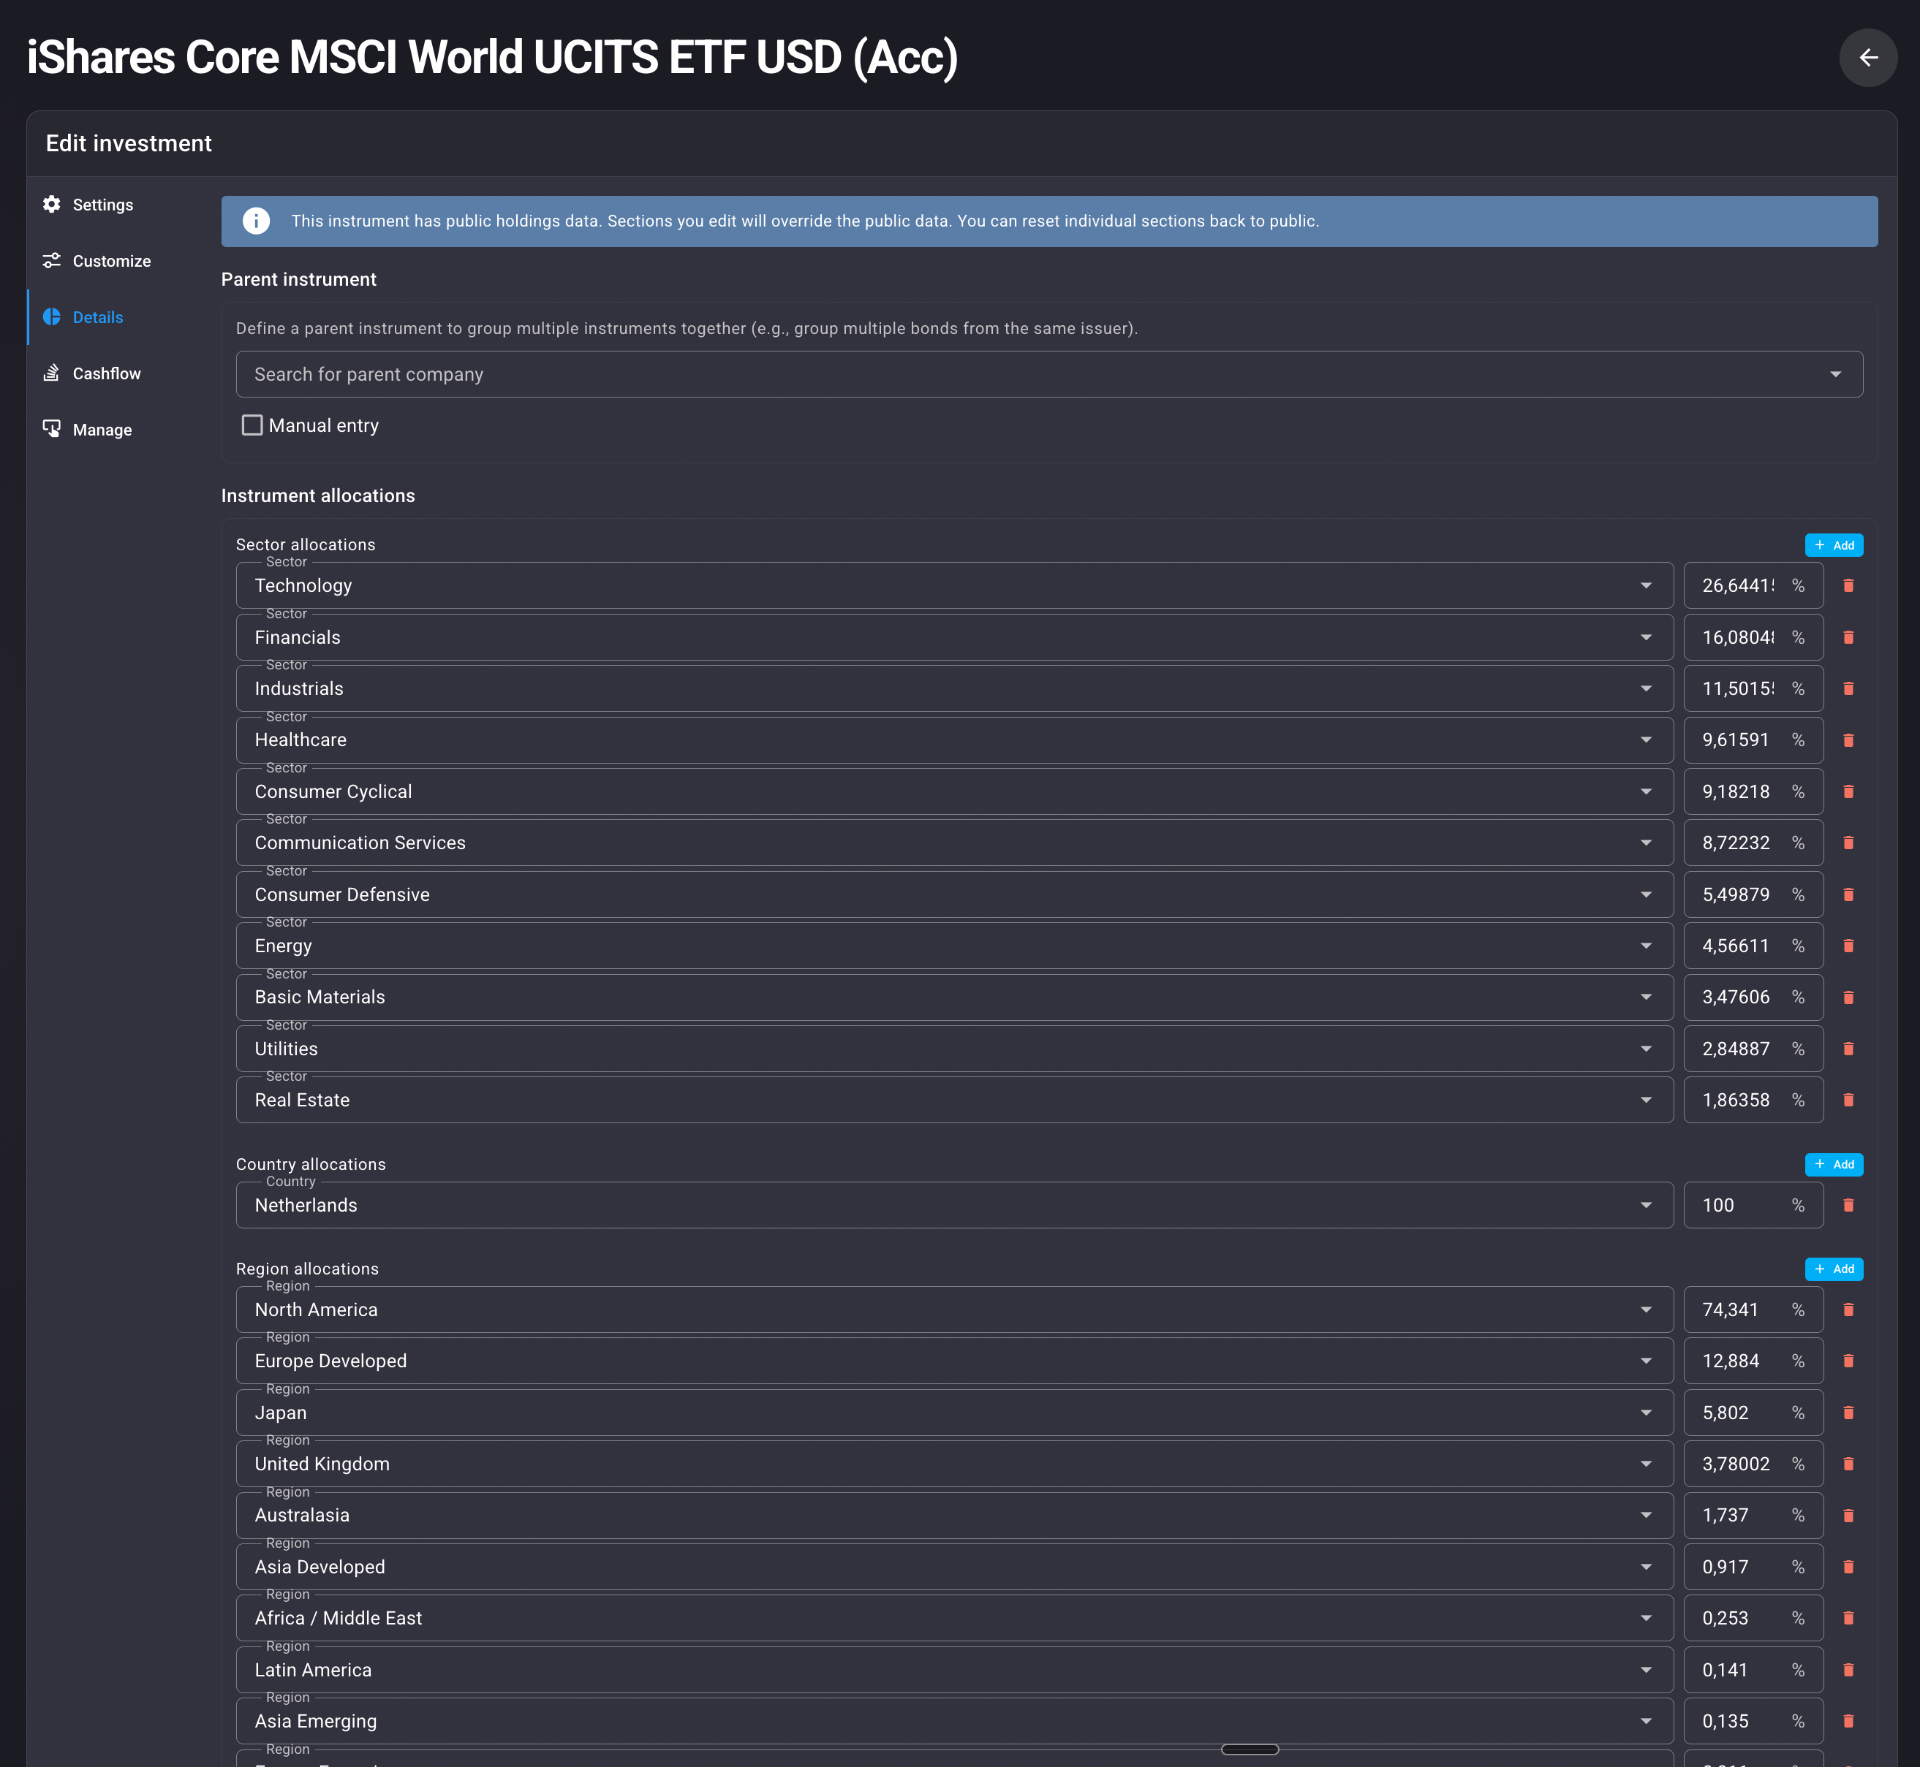
Look through your ETFs to your real exposure
Hold VWCE or an MSCI World ETF? Portfellow drills through to underlying companies, sectors, industries, countries and regions — so the 38% tech overweight you didn't know you had stops being a surprise.
Learn more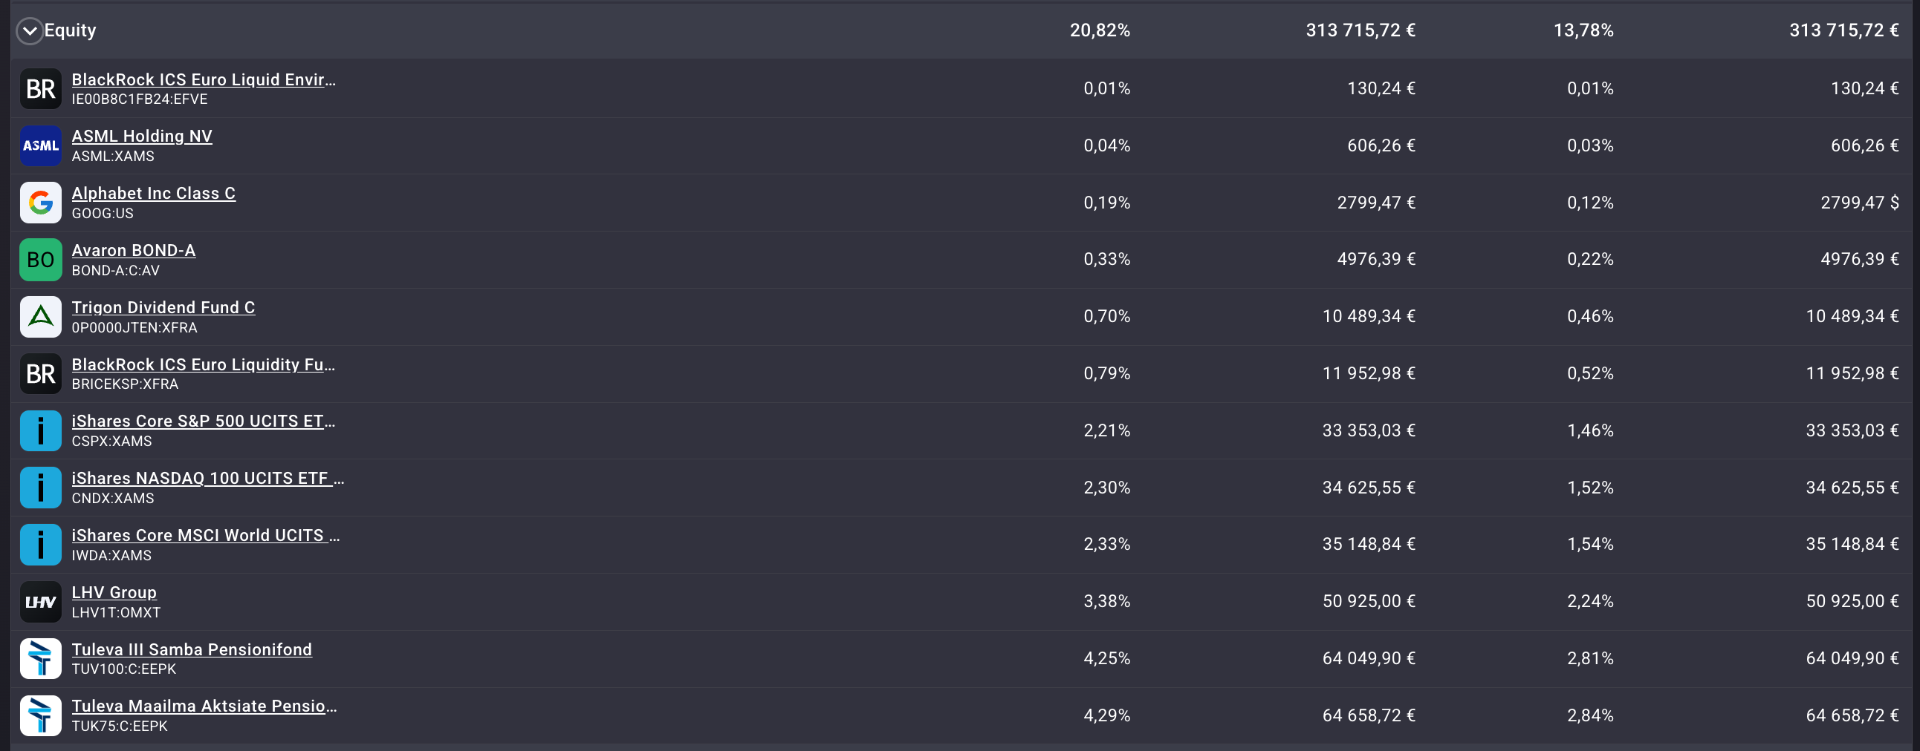
Allocation across every broker, every currency
One donut, one hierarchical table. See exactly what % of your net worth each position represents — multi-currency, multi-broker, multi-asset-class.
Learn moreBuilt specifically for active stock investors
Multi-broker aggregation
Interactive Brokers, Lightyear, LHV, Swedbank — combine every account into one portfolio.
Money-weighted XIRR
The only return calculation that respects when you actually put money in. Computed across your full history.
Built-in benchmarks
S&P 500, Nasdaq 100, Dow Jones, Vanguard Total World — overlay them on your portfolio chart in one click.
Sector & country exposure
See your real concentration by sector, industry, country and region — including what's hiding inside your ETFs.
FX-normalized returns
Every return reported in your home currency, with FX impact made explicit instead of hidden.
Drawdown & volatility
Max drawdown, standard deviation, mean return — the risk metrics most broker apps don't show you.
Every position, fully analyzed
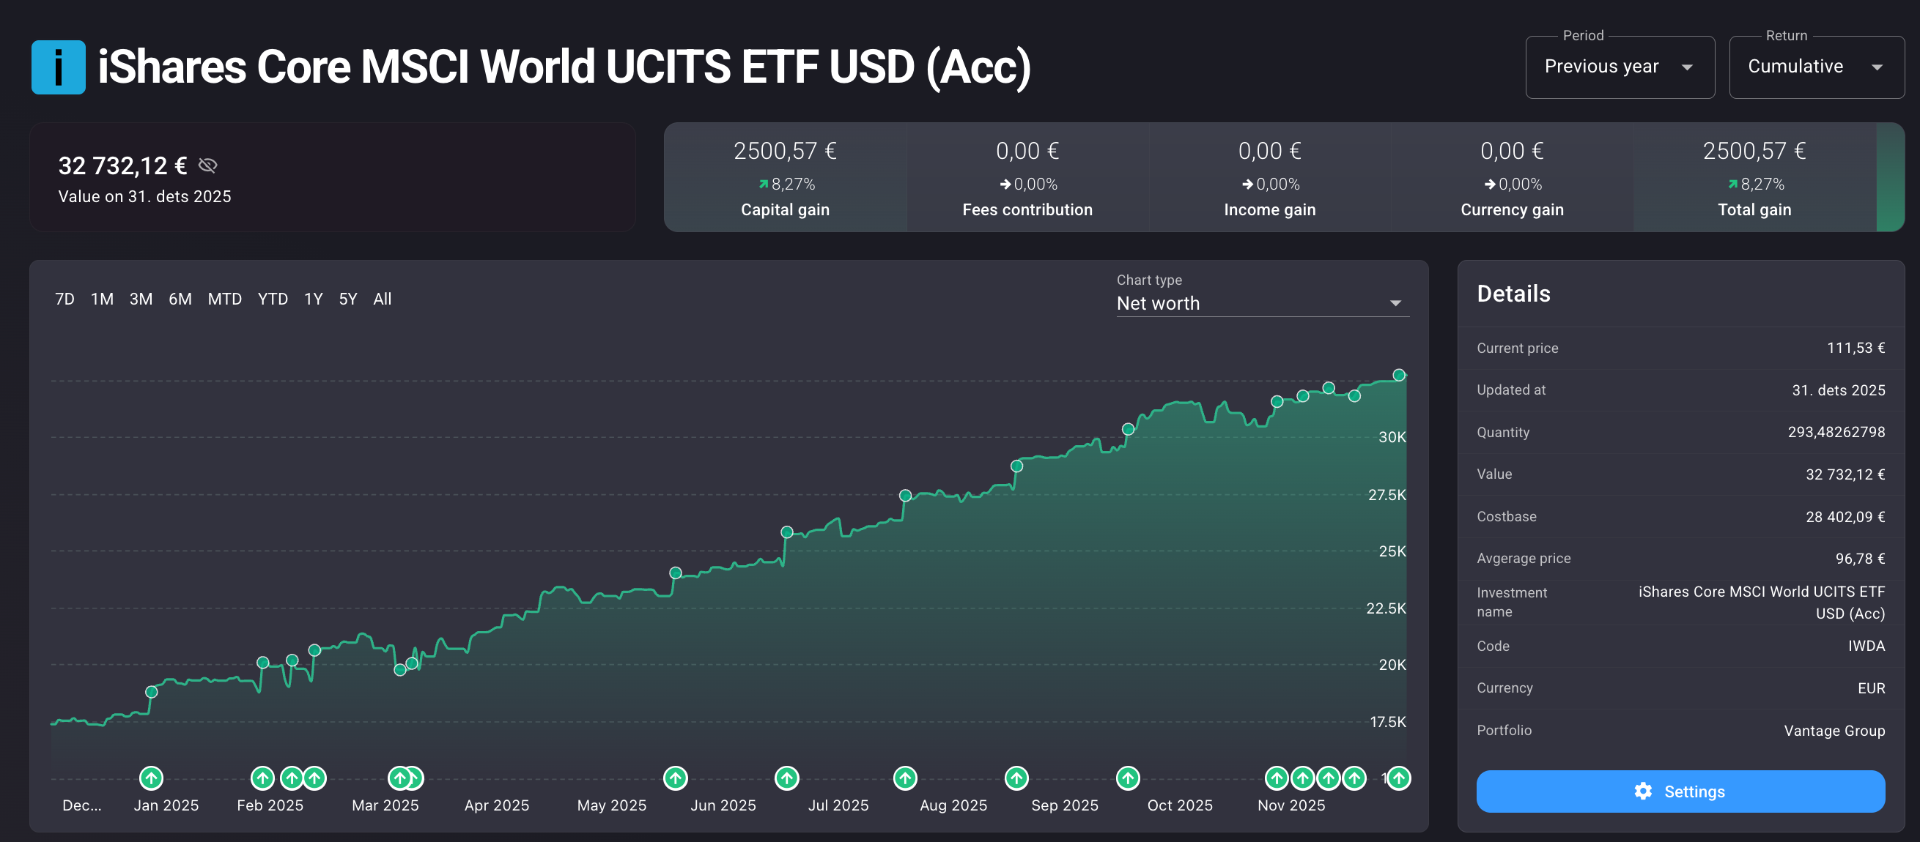
Each holding gets a full workspace — every trade, every dividend, capital and income gain split out cleanly.
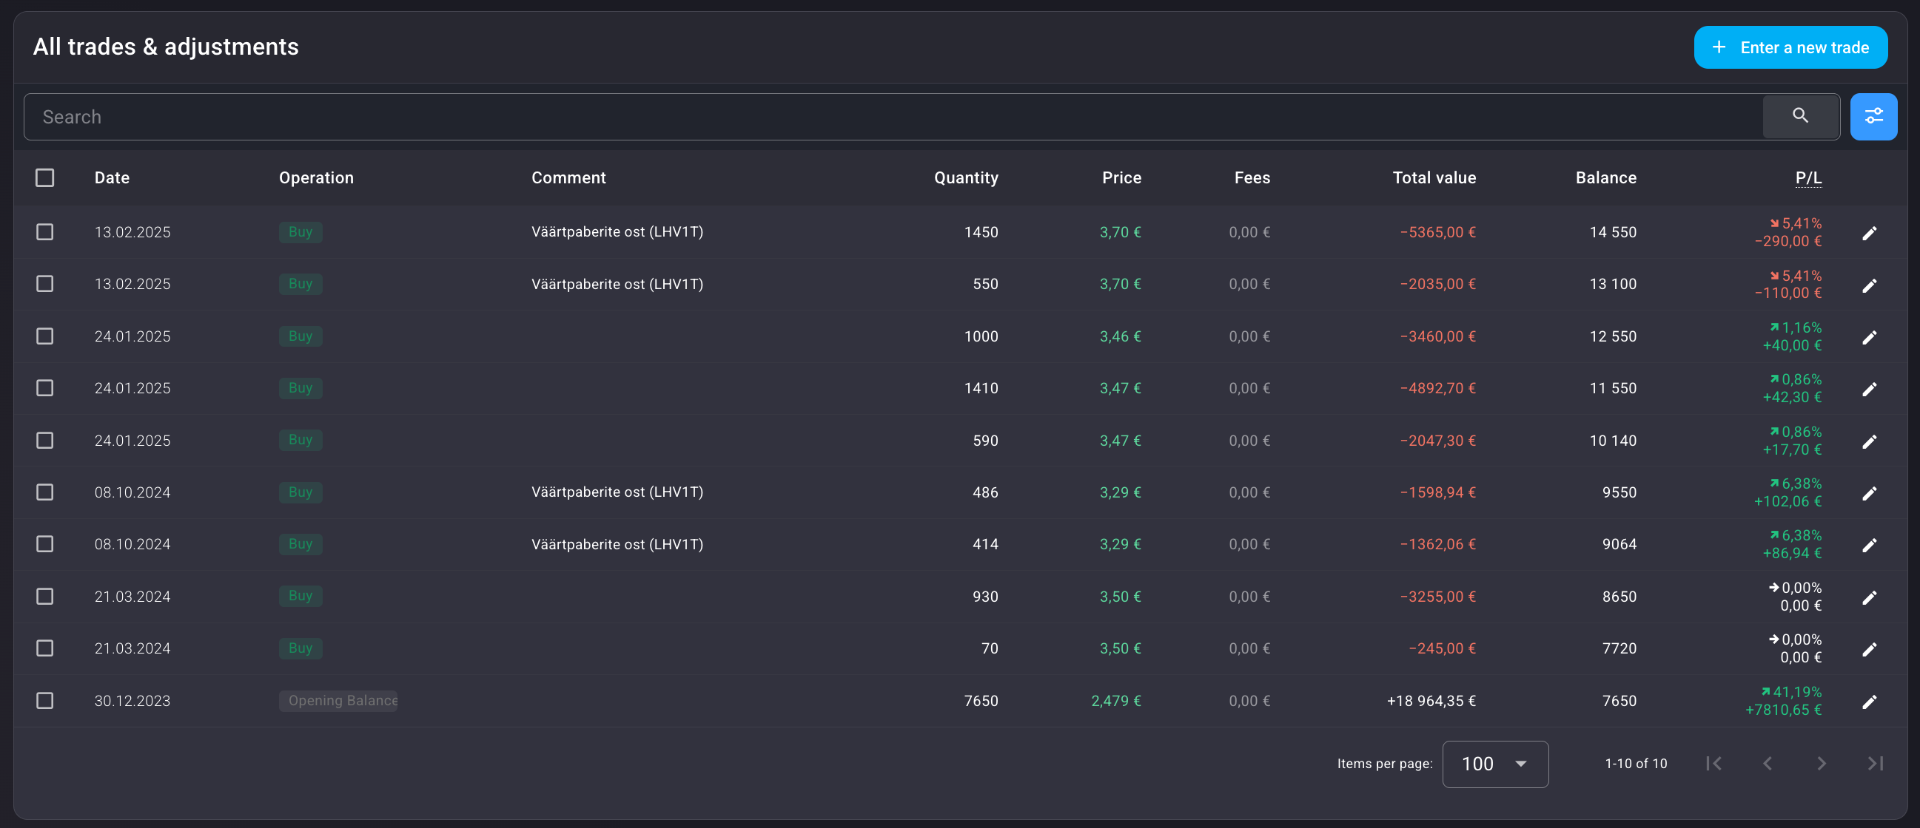
Every buy, sell and adjustment recorded with lot-level P/L.
Real-life use cases
Are you actually beating the S&P 500?
Overlay your money-weighted, FX-normalized return against SPY over 1, 3 and 5 years. Settle the question once and for all.
Catch a tech overweight before it bites
See that your real tech exposure — including ETF look-through — has crept to 42%. Rebalance before the next rotation hurts you.
Cut the 5-year deadwood
Rank every holding by 5-year annualized return. Identify the chronic underperformers you've been holding on hope, and act with evidence.
Fits your strategy
Conviction investing
A focused book of 10–25 names. Track each position's contribution to total return at the lot level.
Quality-growth / GARP
Compare your annualized return against Nasdaq 100 — the right benchmark for a growth-tilted portfolio.
Contrarian / value
Patience requires evidence. Multi-year XIRR shows whether your contrarian theses are actually paying off.
Why Portfellow is different
Broker apps are designed to keep you trading. Portfellow is designed to tell you the truth — broker-agnostic, benchmark-native, exposure-clear.
Broker-agnostic
Combine every account in one view — no broker has an incentive to make this easy. We do.
Benchmark-native
Comparing yourself to the index isn't an afterthought. It's the headline chart.
Exposure clarity
ETF look-through reveals what you really own — sectors, countries and companies, not ticker symbols.
Suggested workflow
Five steps from fragmented brokers to evidence-based decisions.
Connect brokers
Import positions and trades from every broker — manual or automated.
Compute XIRR
Portfellow calculates true money-weighted return across your whole history.
Compare benchmarks
Overlay S&P 500, Nasdaq 100 or World — pick the right yardstick.
Review exposure
Drill through ETFs to your real sector and country concentration.
Rebalance
Cut deadwood or double down — with evidence, not gut feel.